
Portfolio & Case Studies
A finance student learning to see the full business picture:
Where data, performance, and decision-making connect.
Building towards the intersection where finance meets corporate strategy.

Most people learn finance from textbooks. I did too.
But textbooks only show you the separate parts: P&Ls, Balance sheet, Cash flow...
The further I went, the more I wanted to see how they actually connect.
How one business decision affects a company's day-to-day operations, and shows up years later in its valuation.
And that's the intersection I want to work in:
Where financial data meets business decisions.
In-depth equity research and valuation thesis for high-conviction opportunities
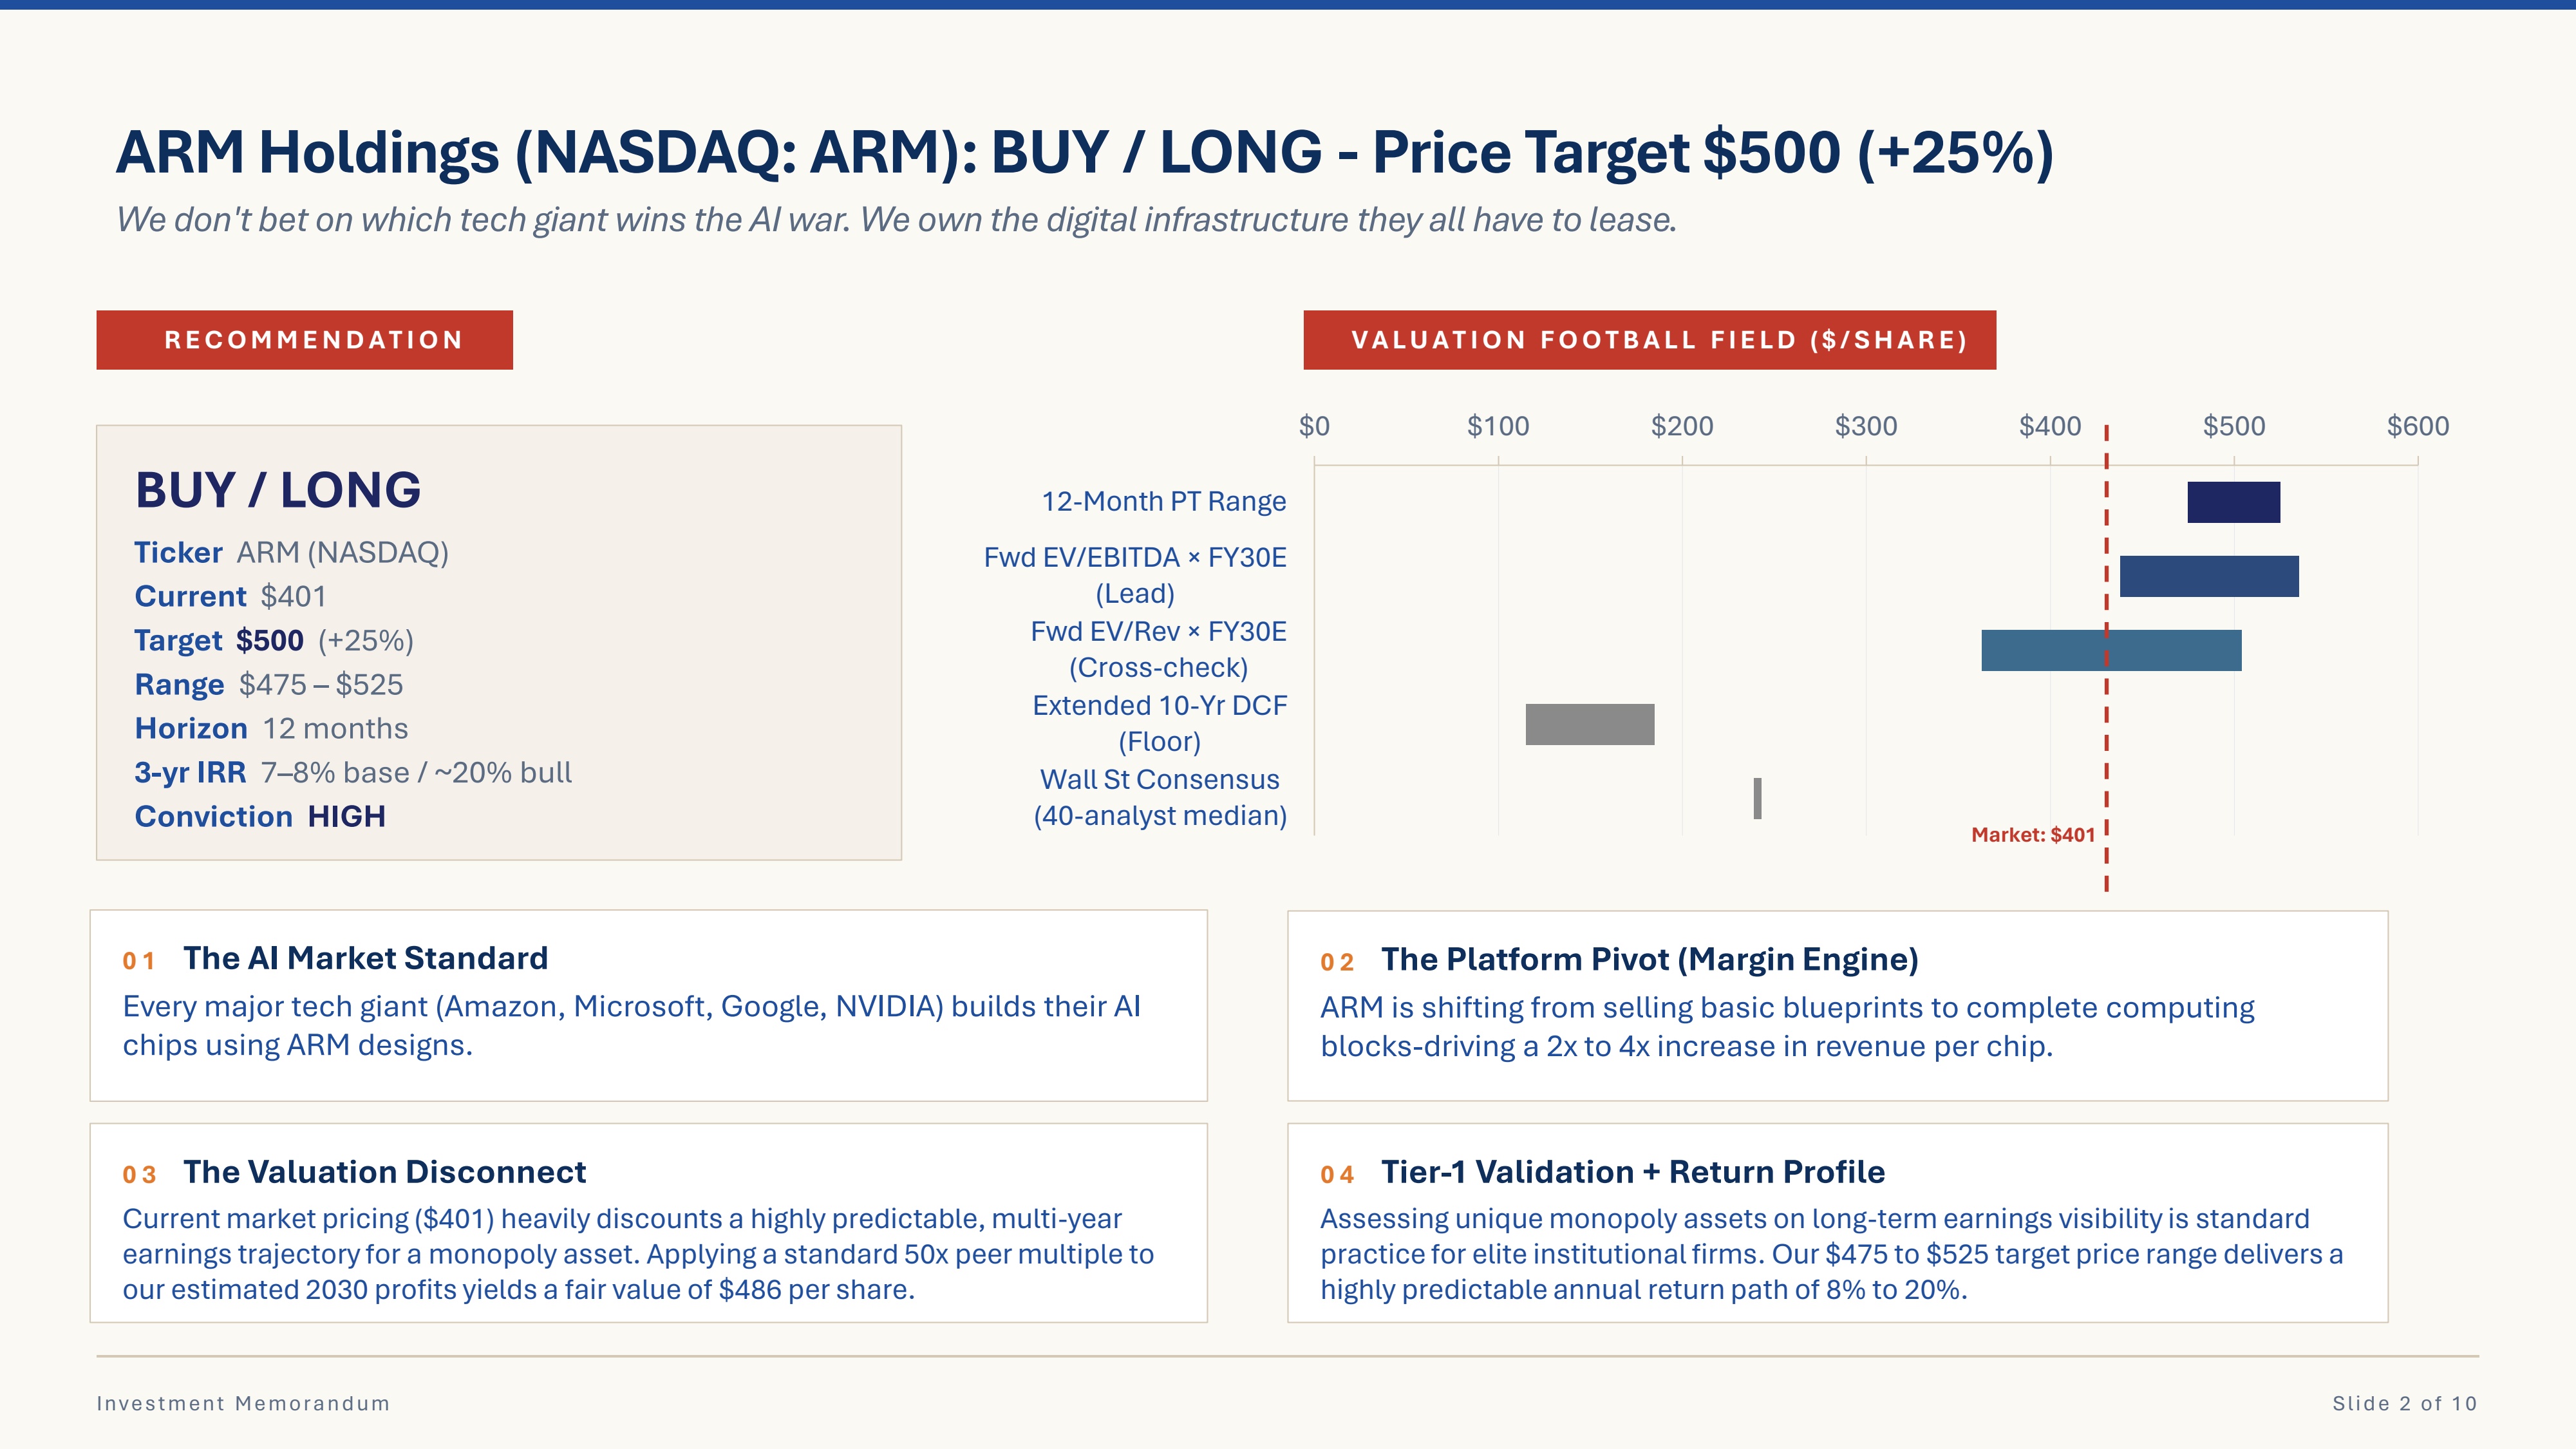
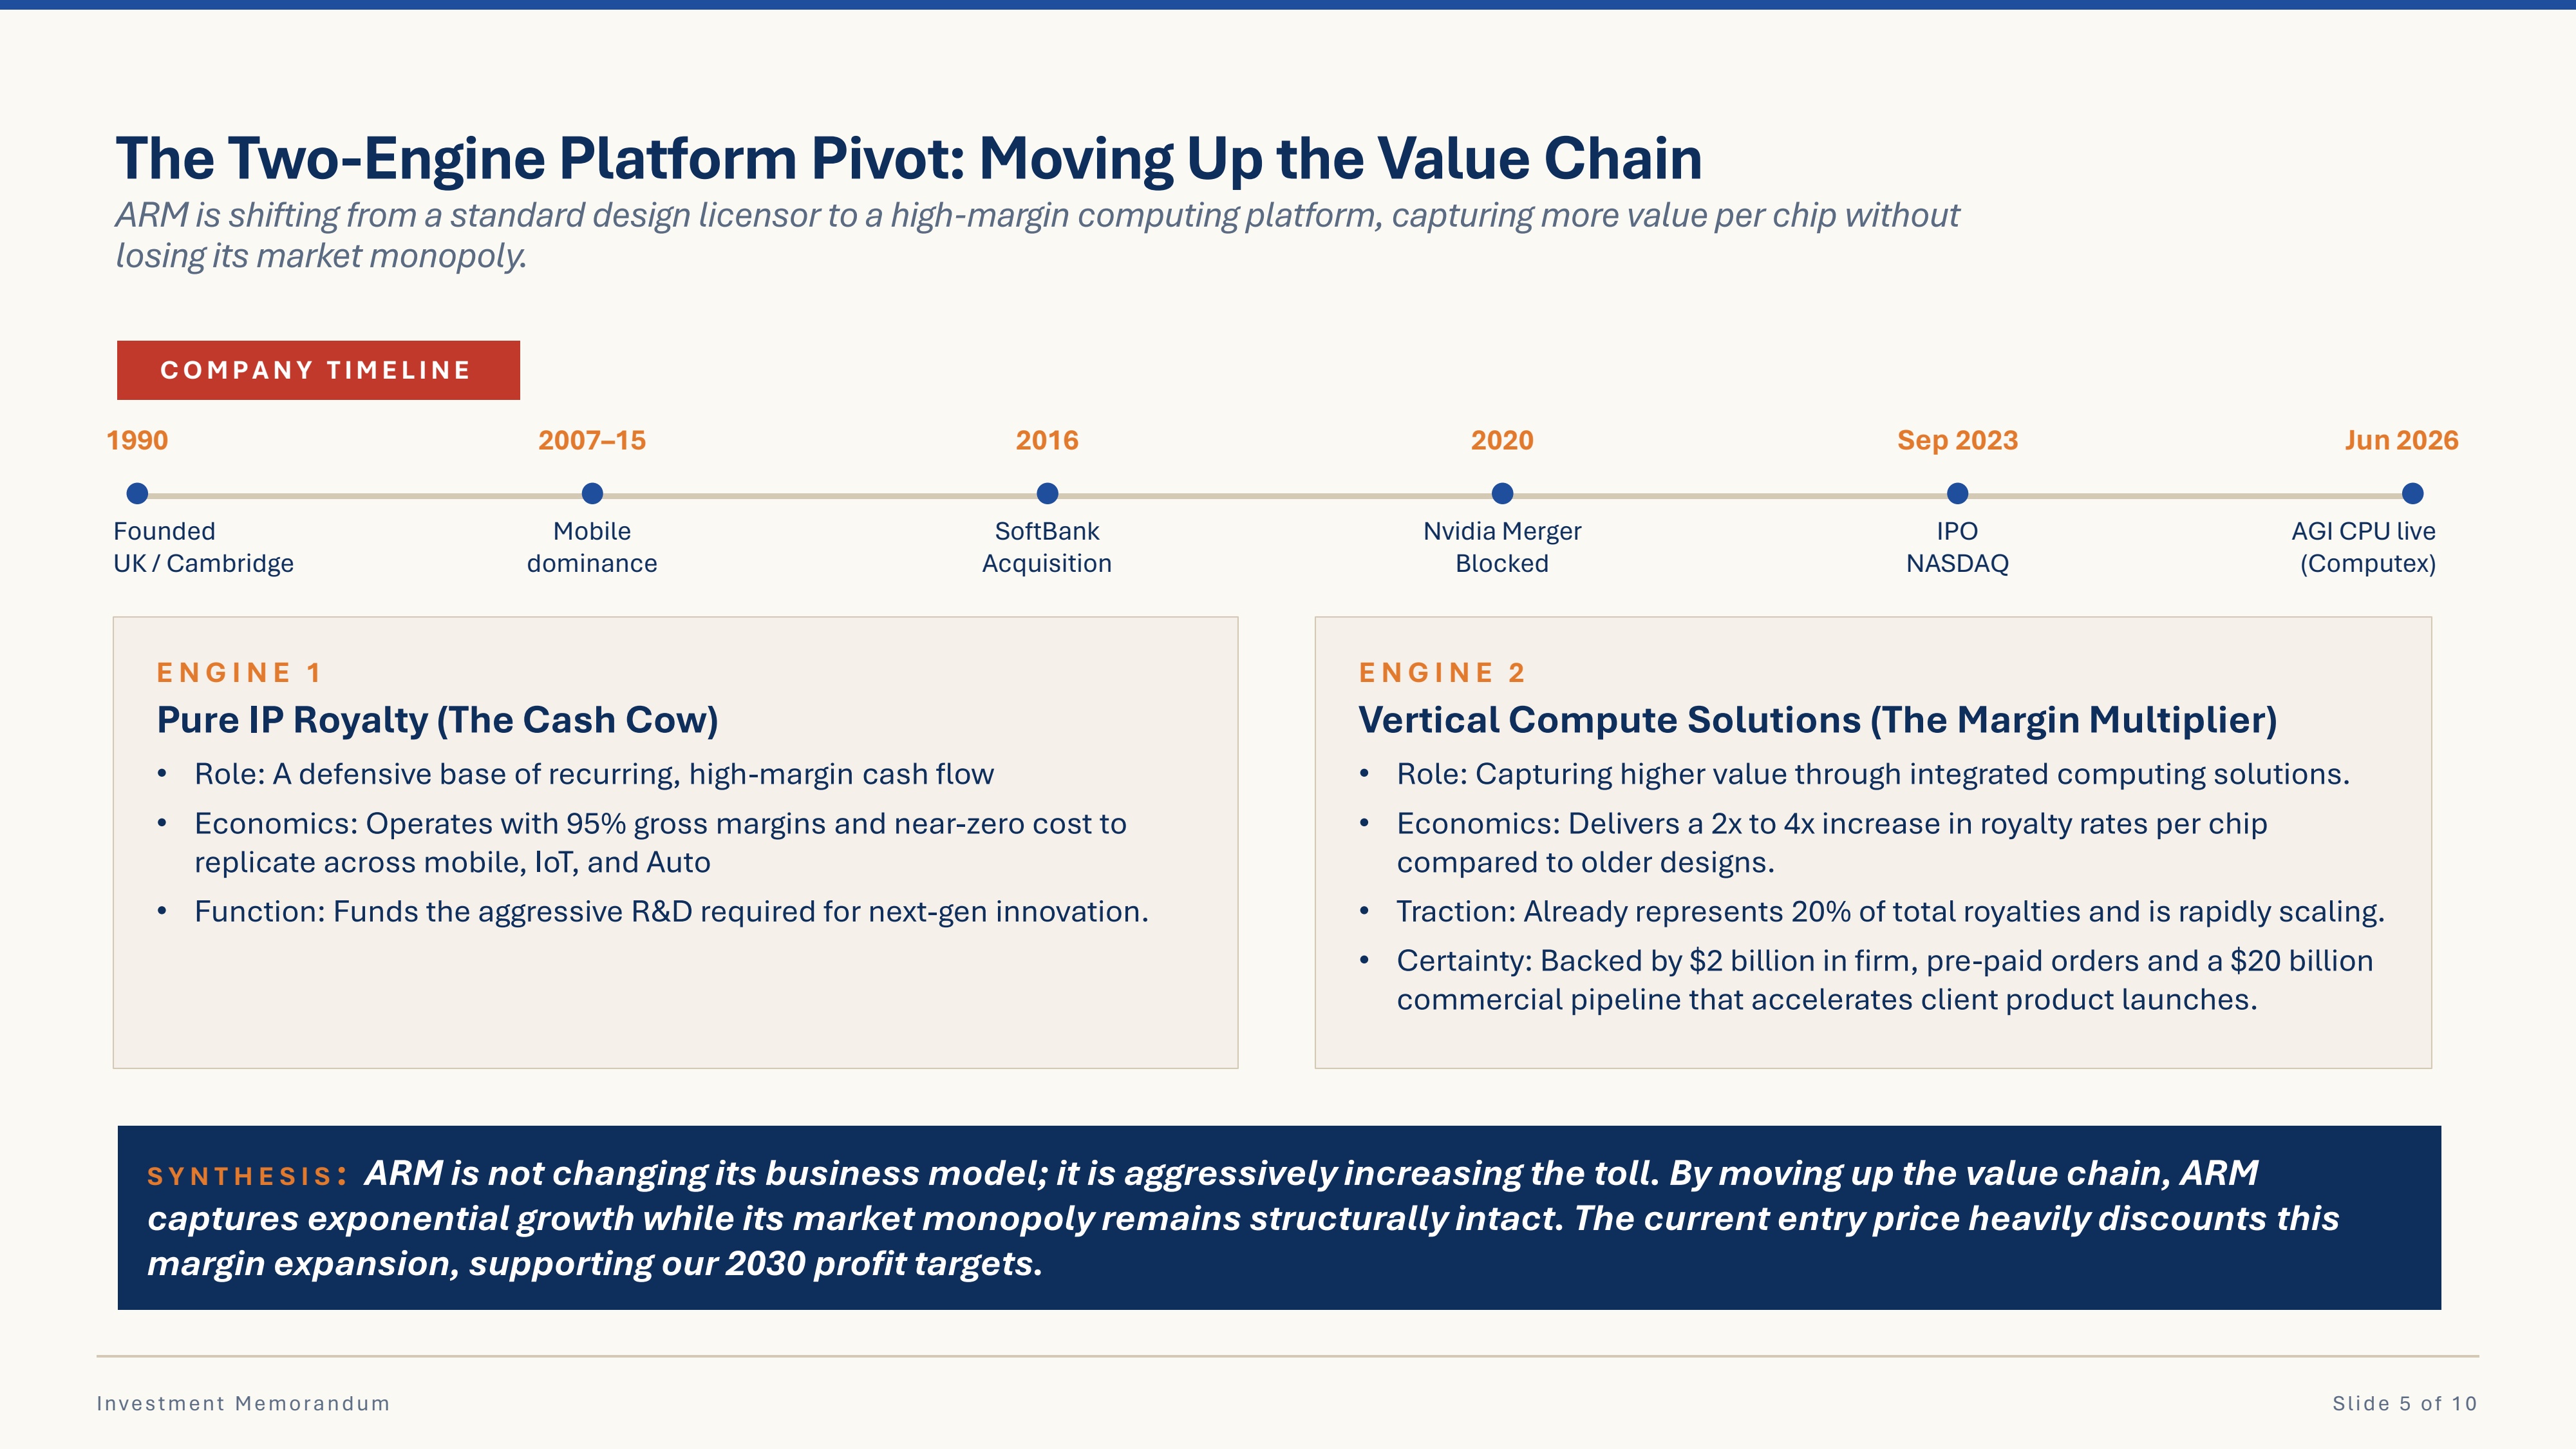
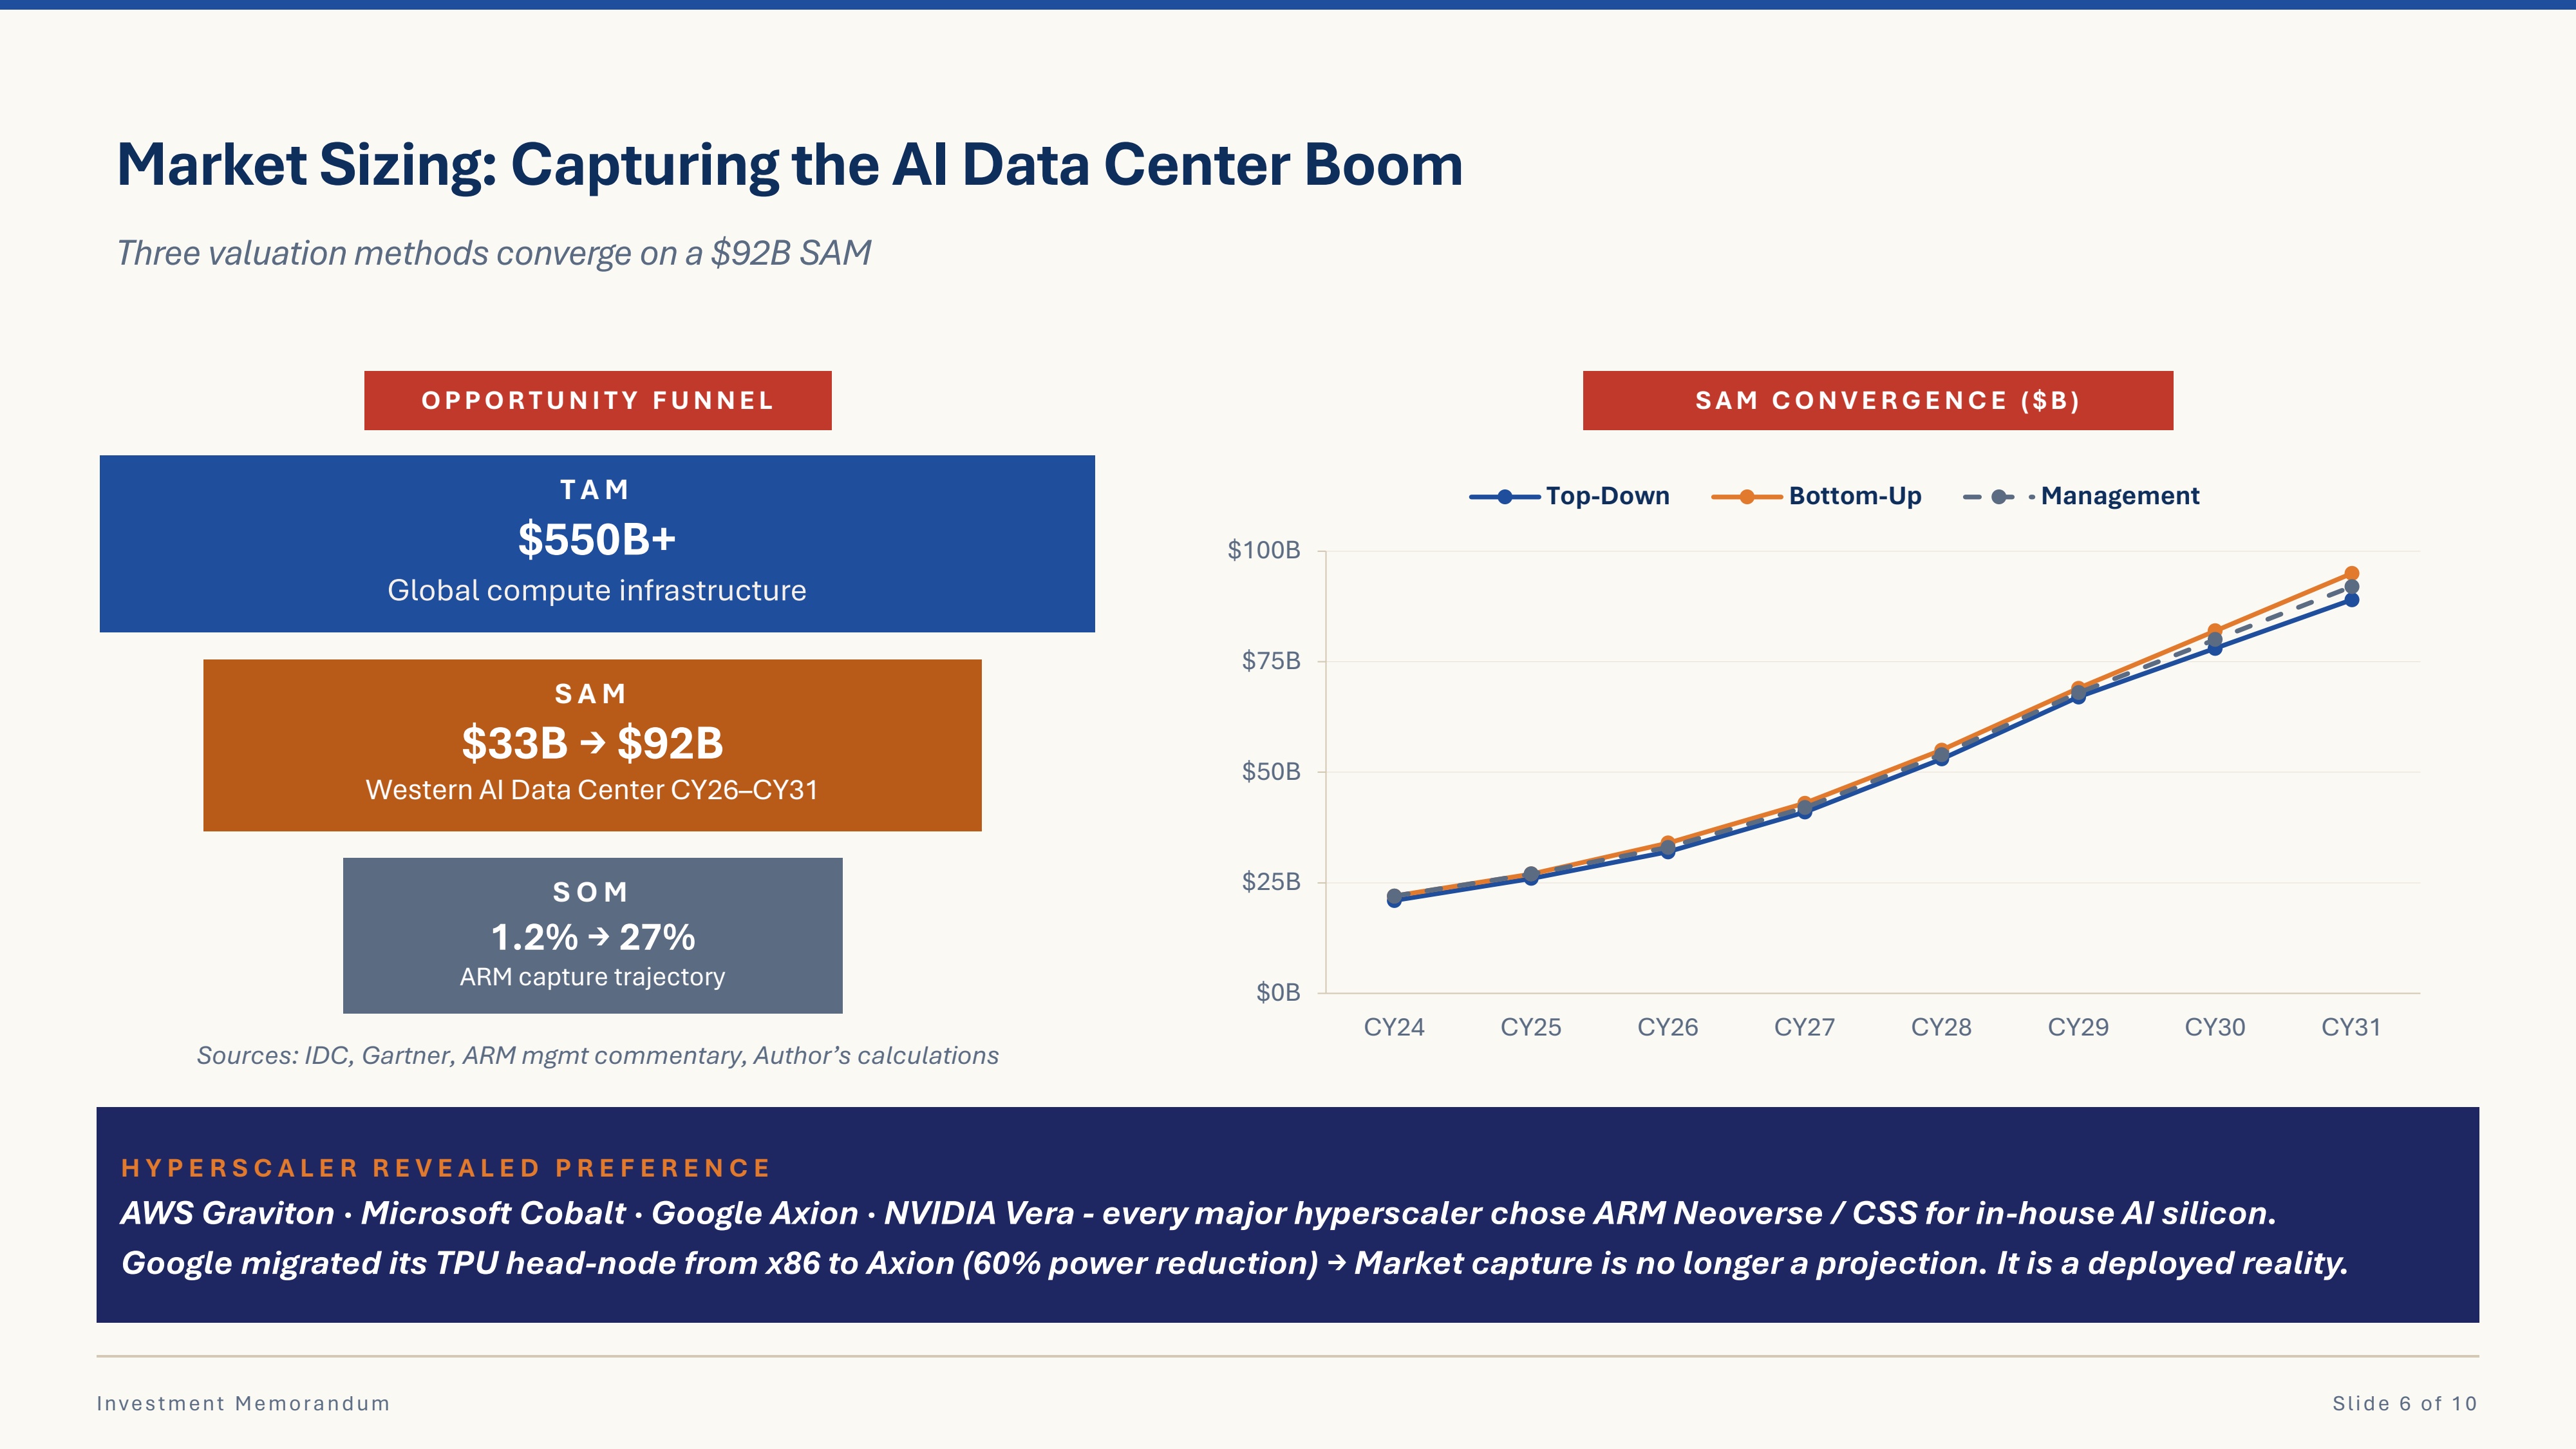
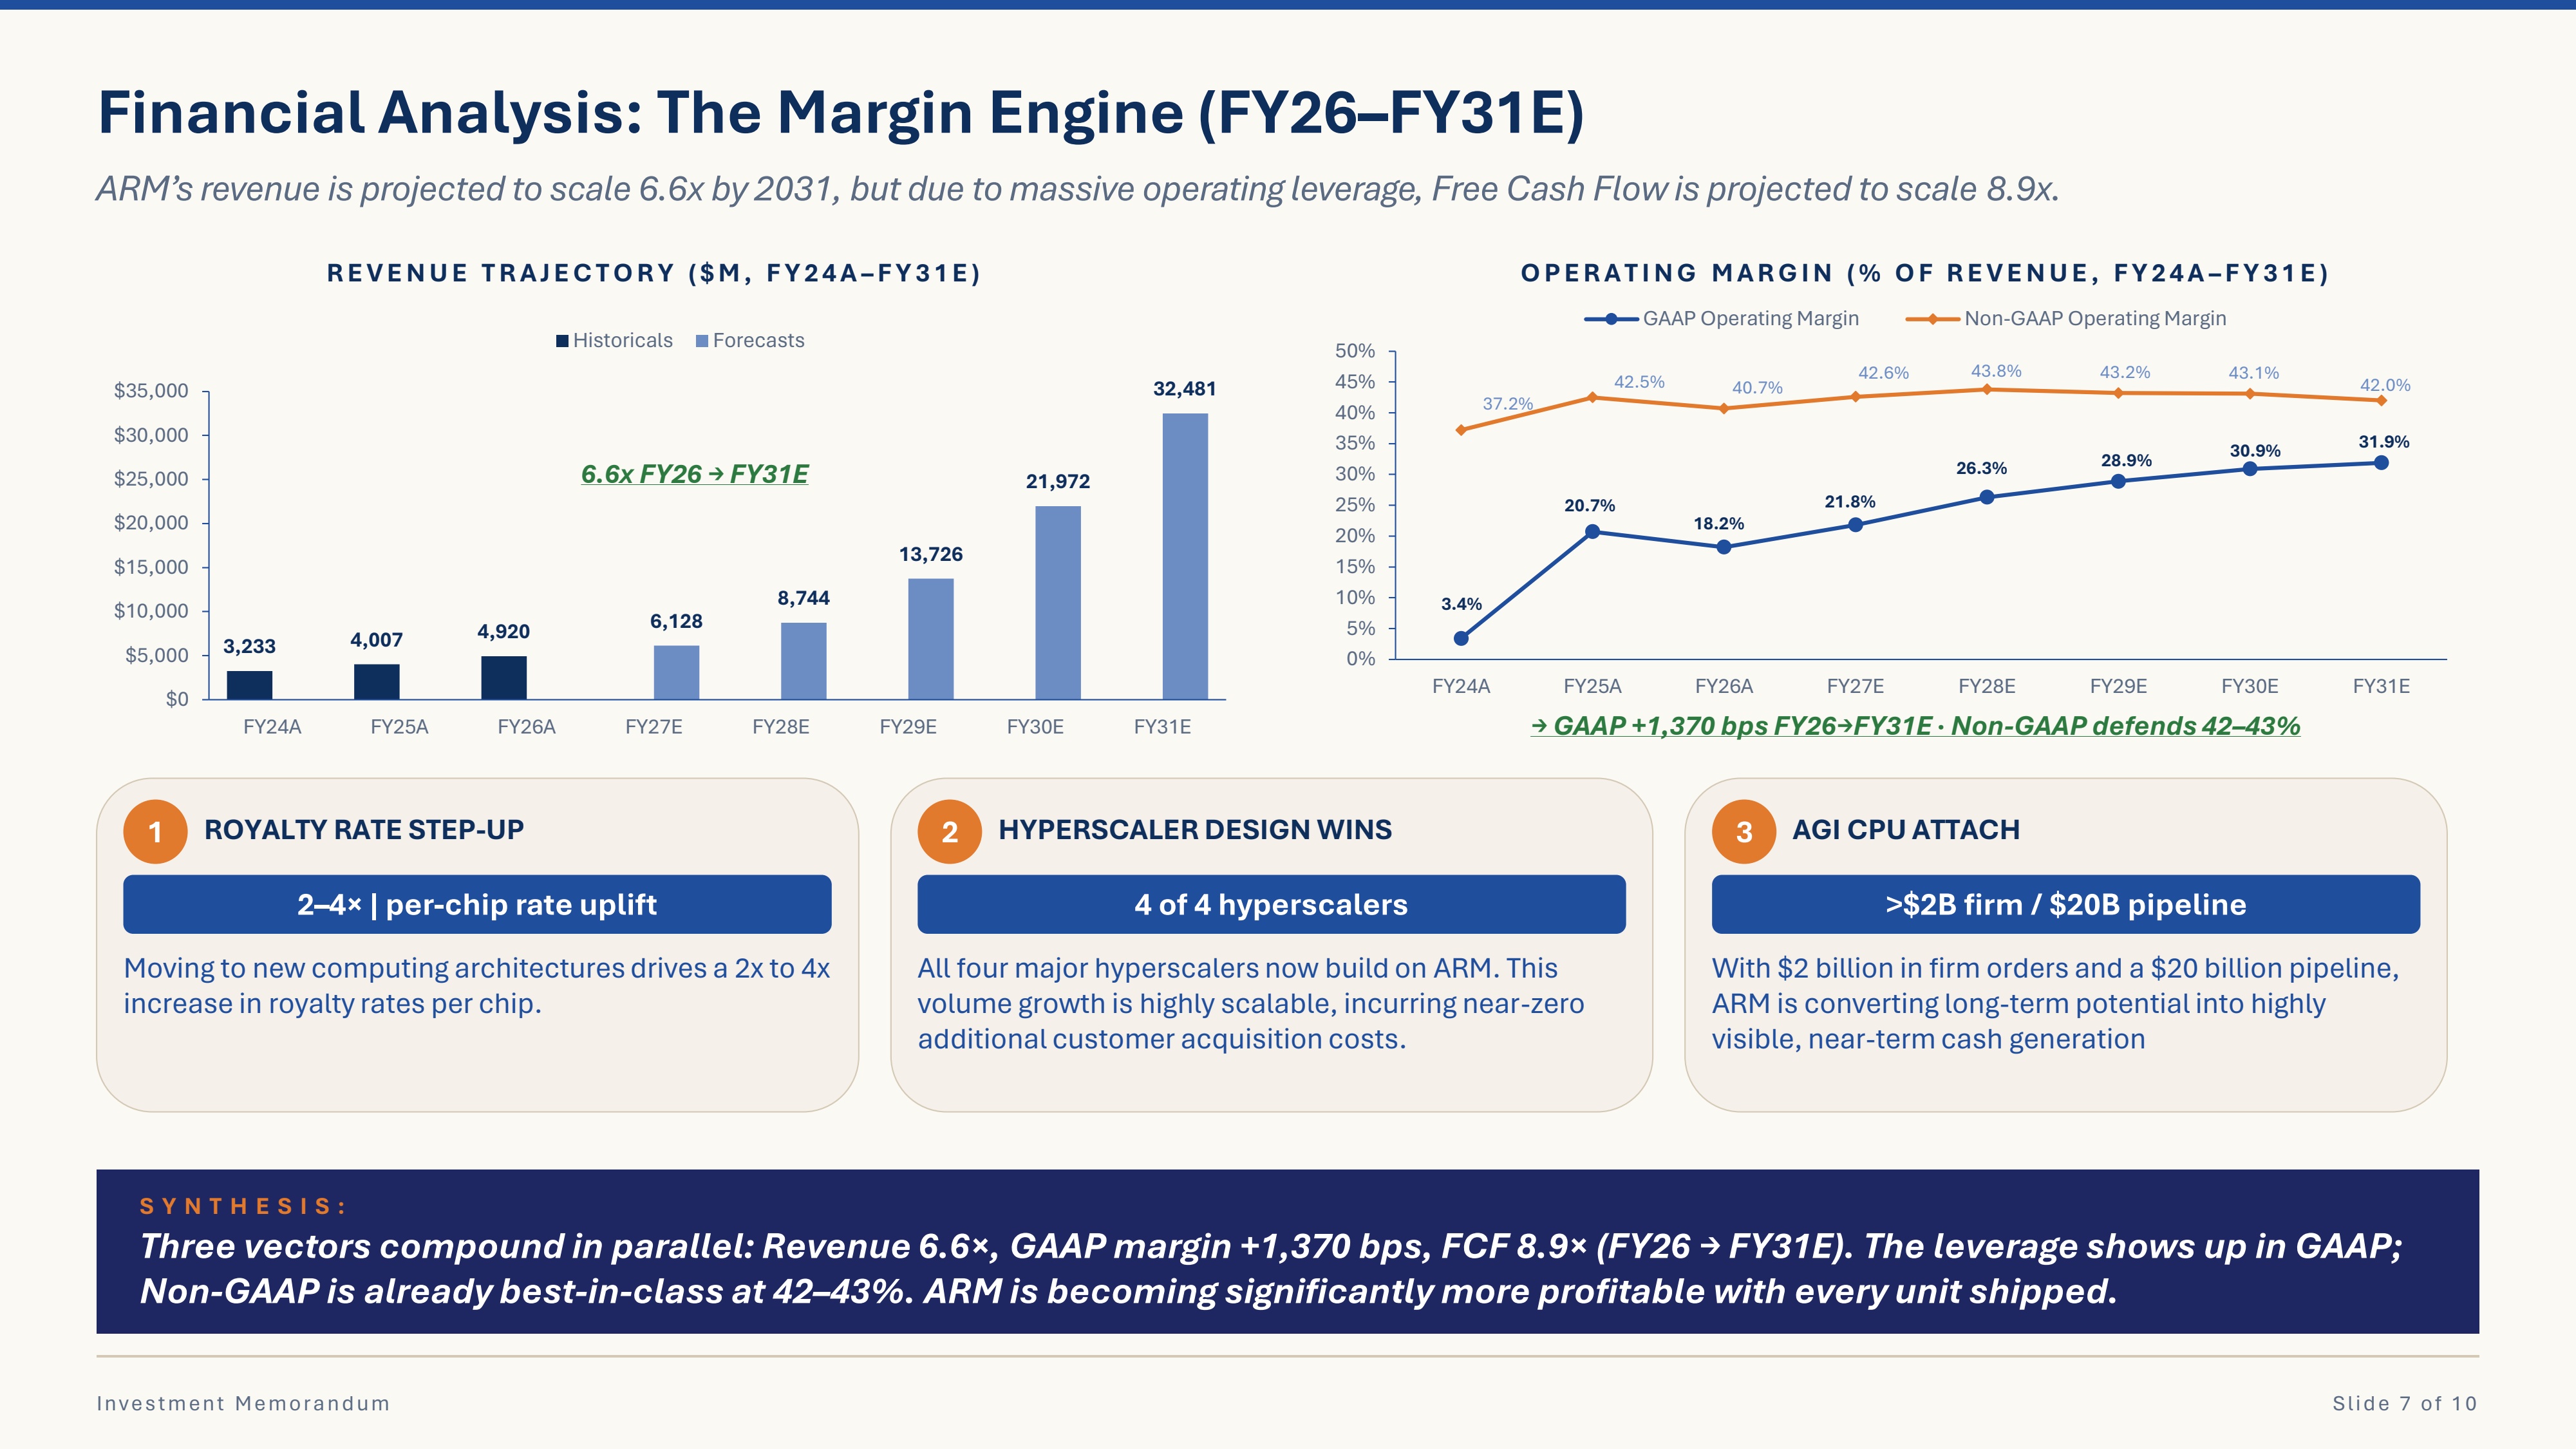
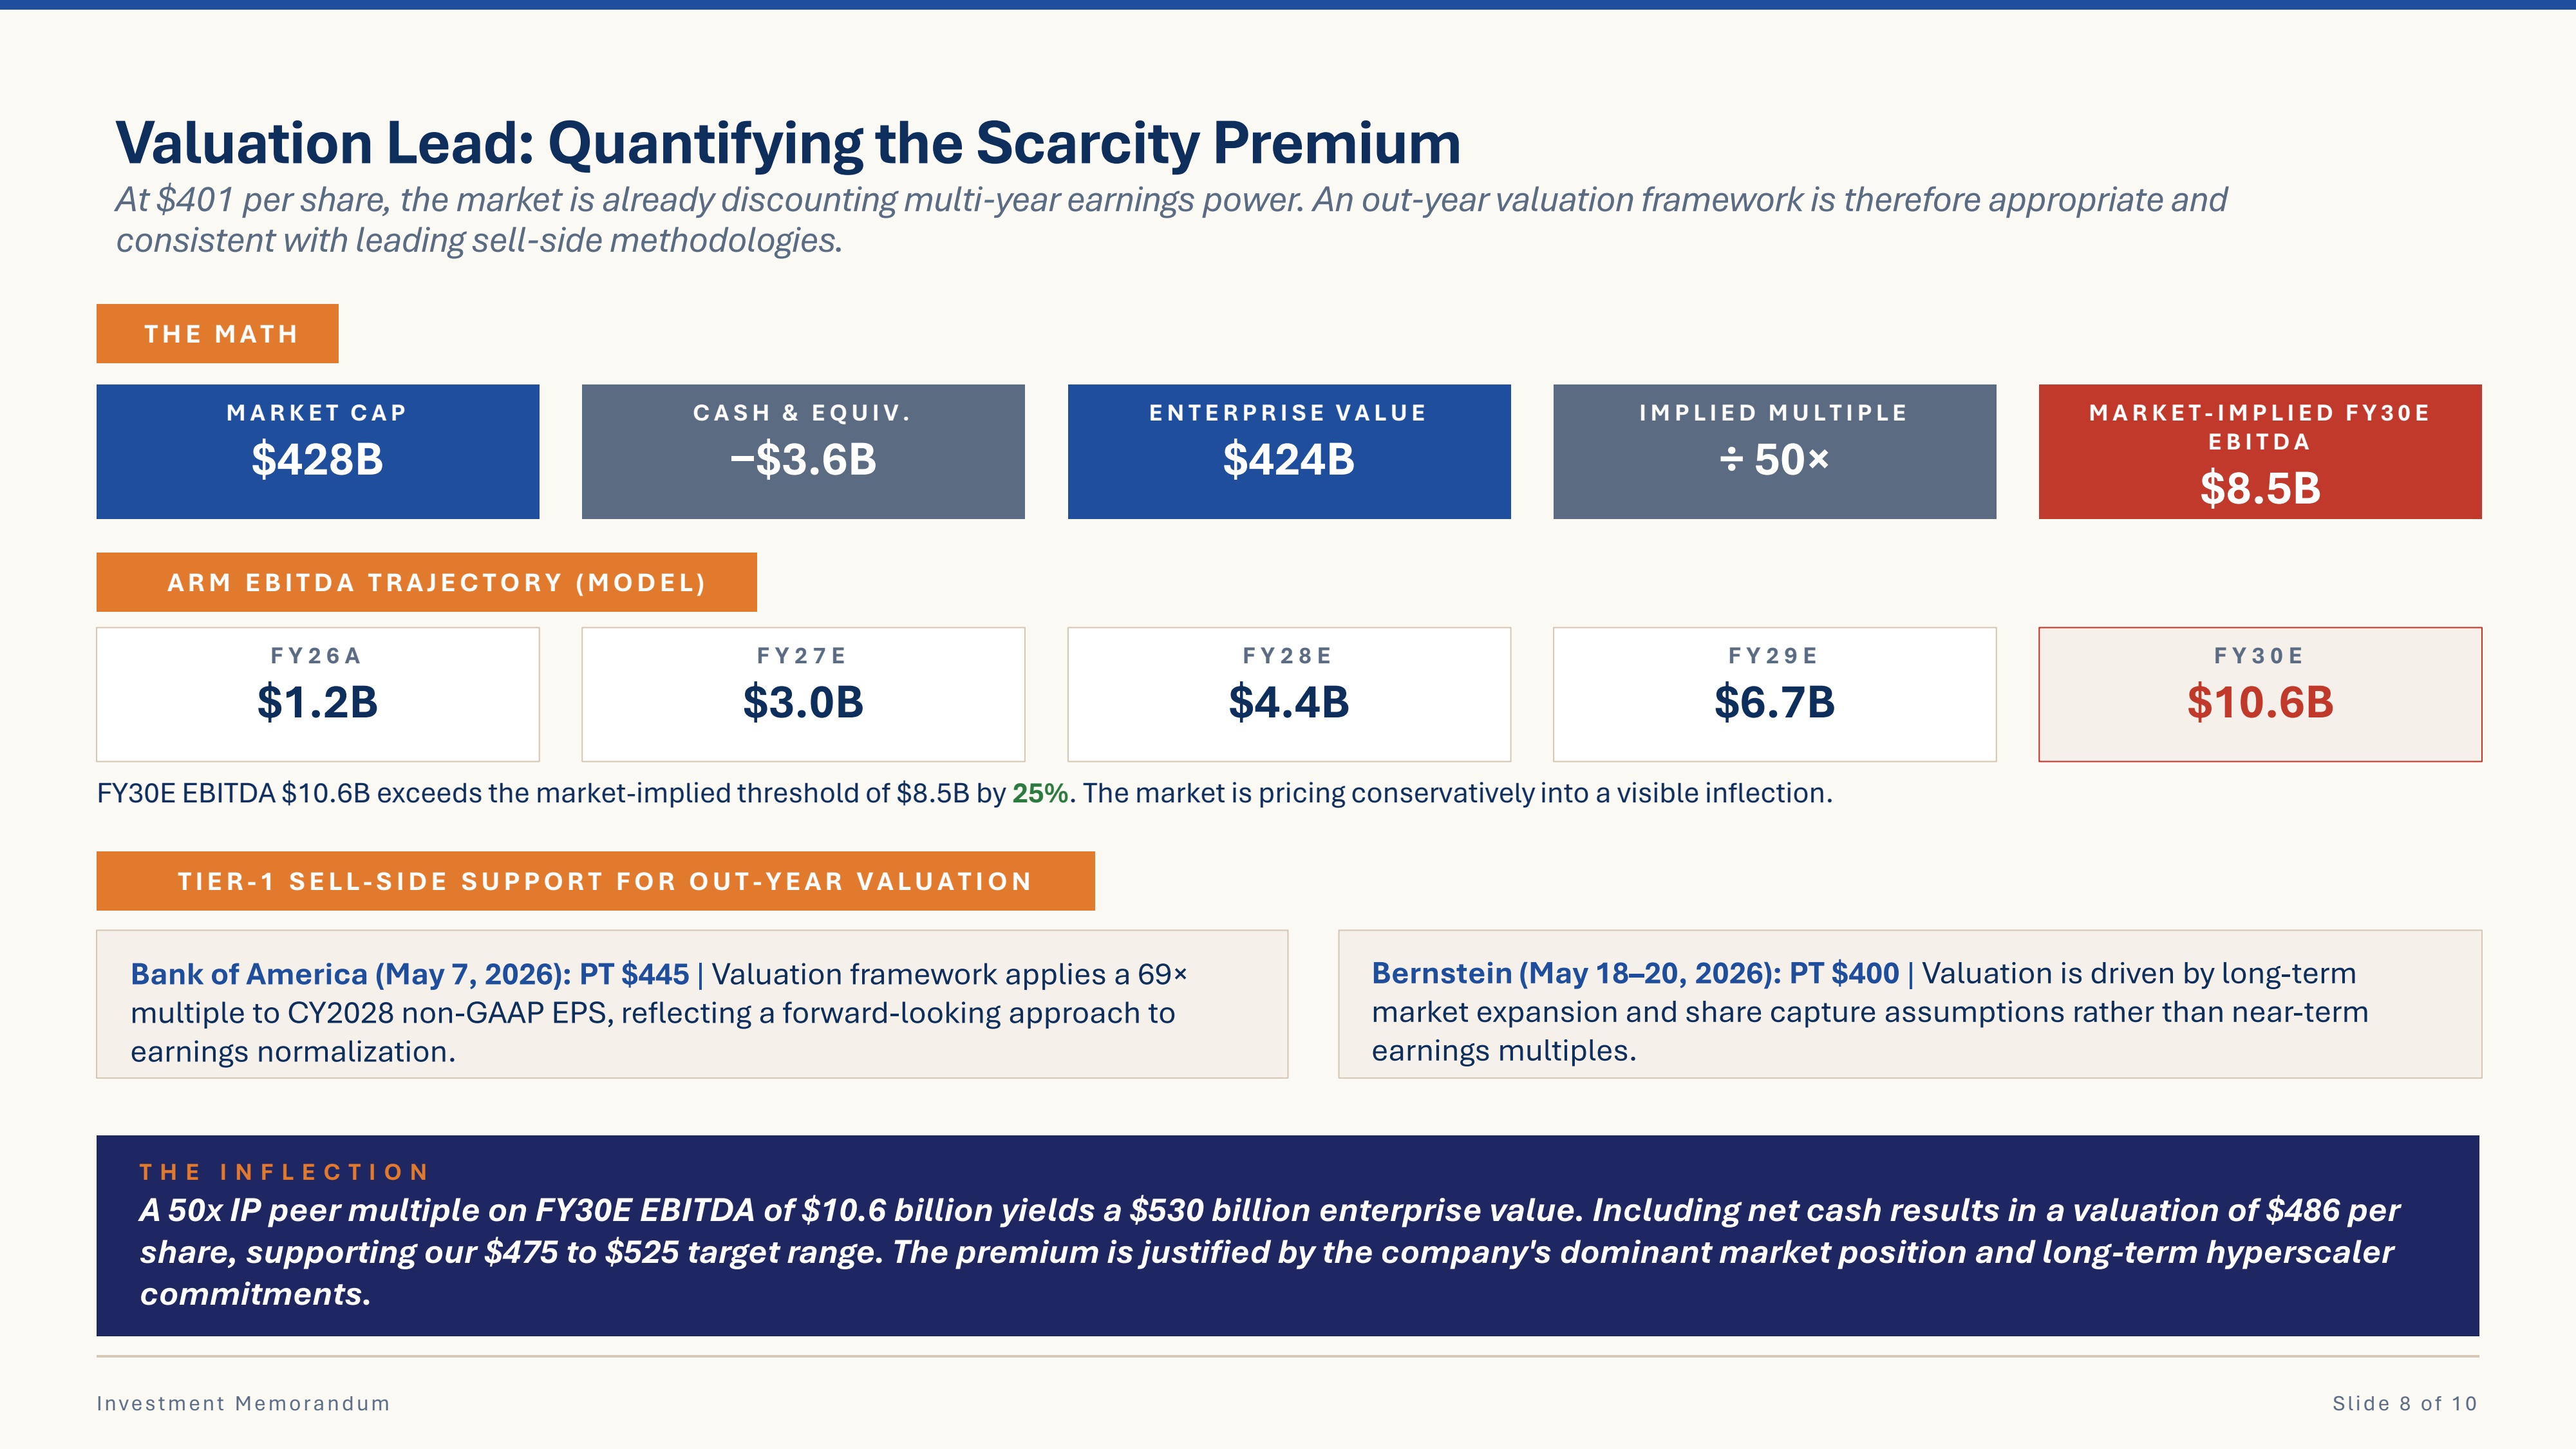
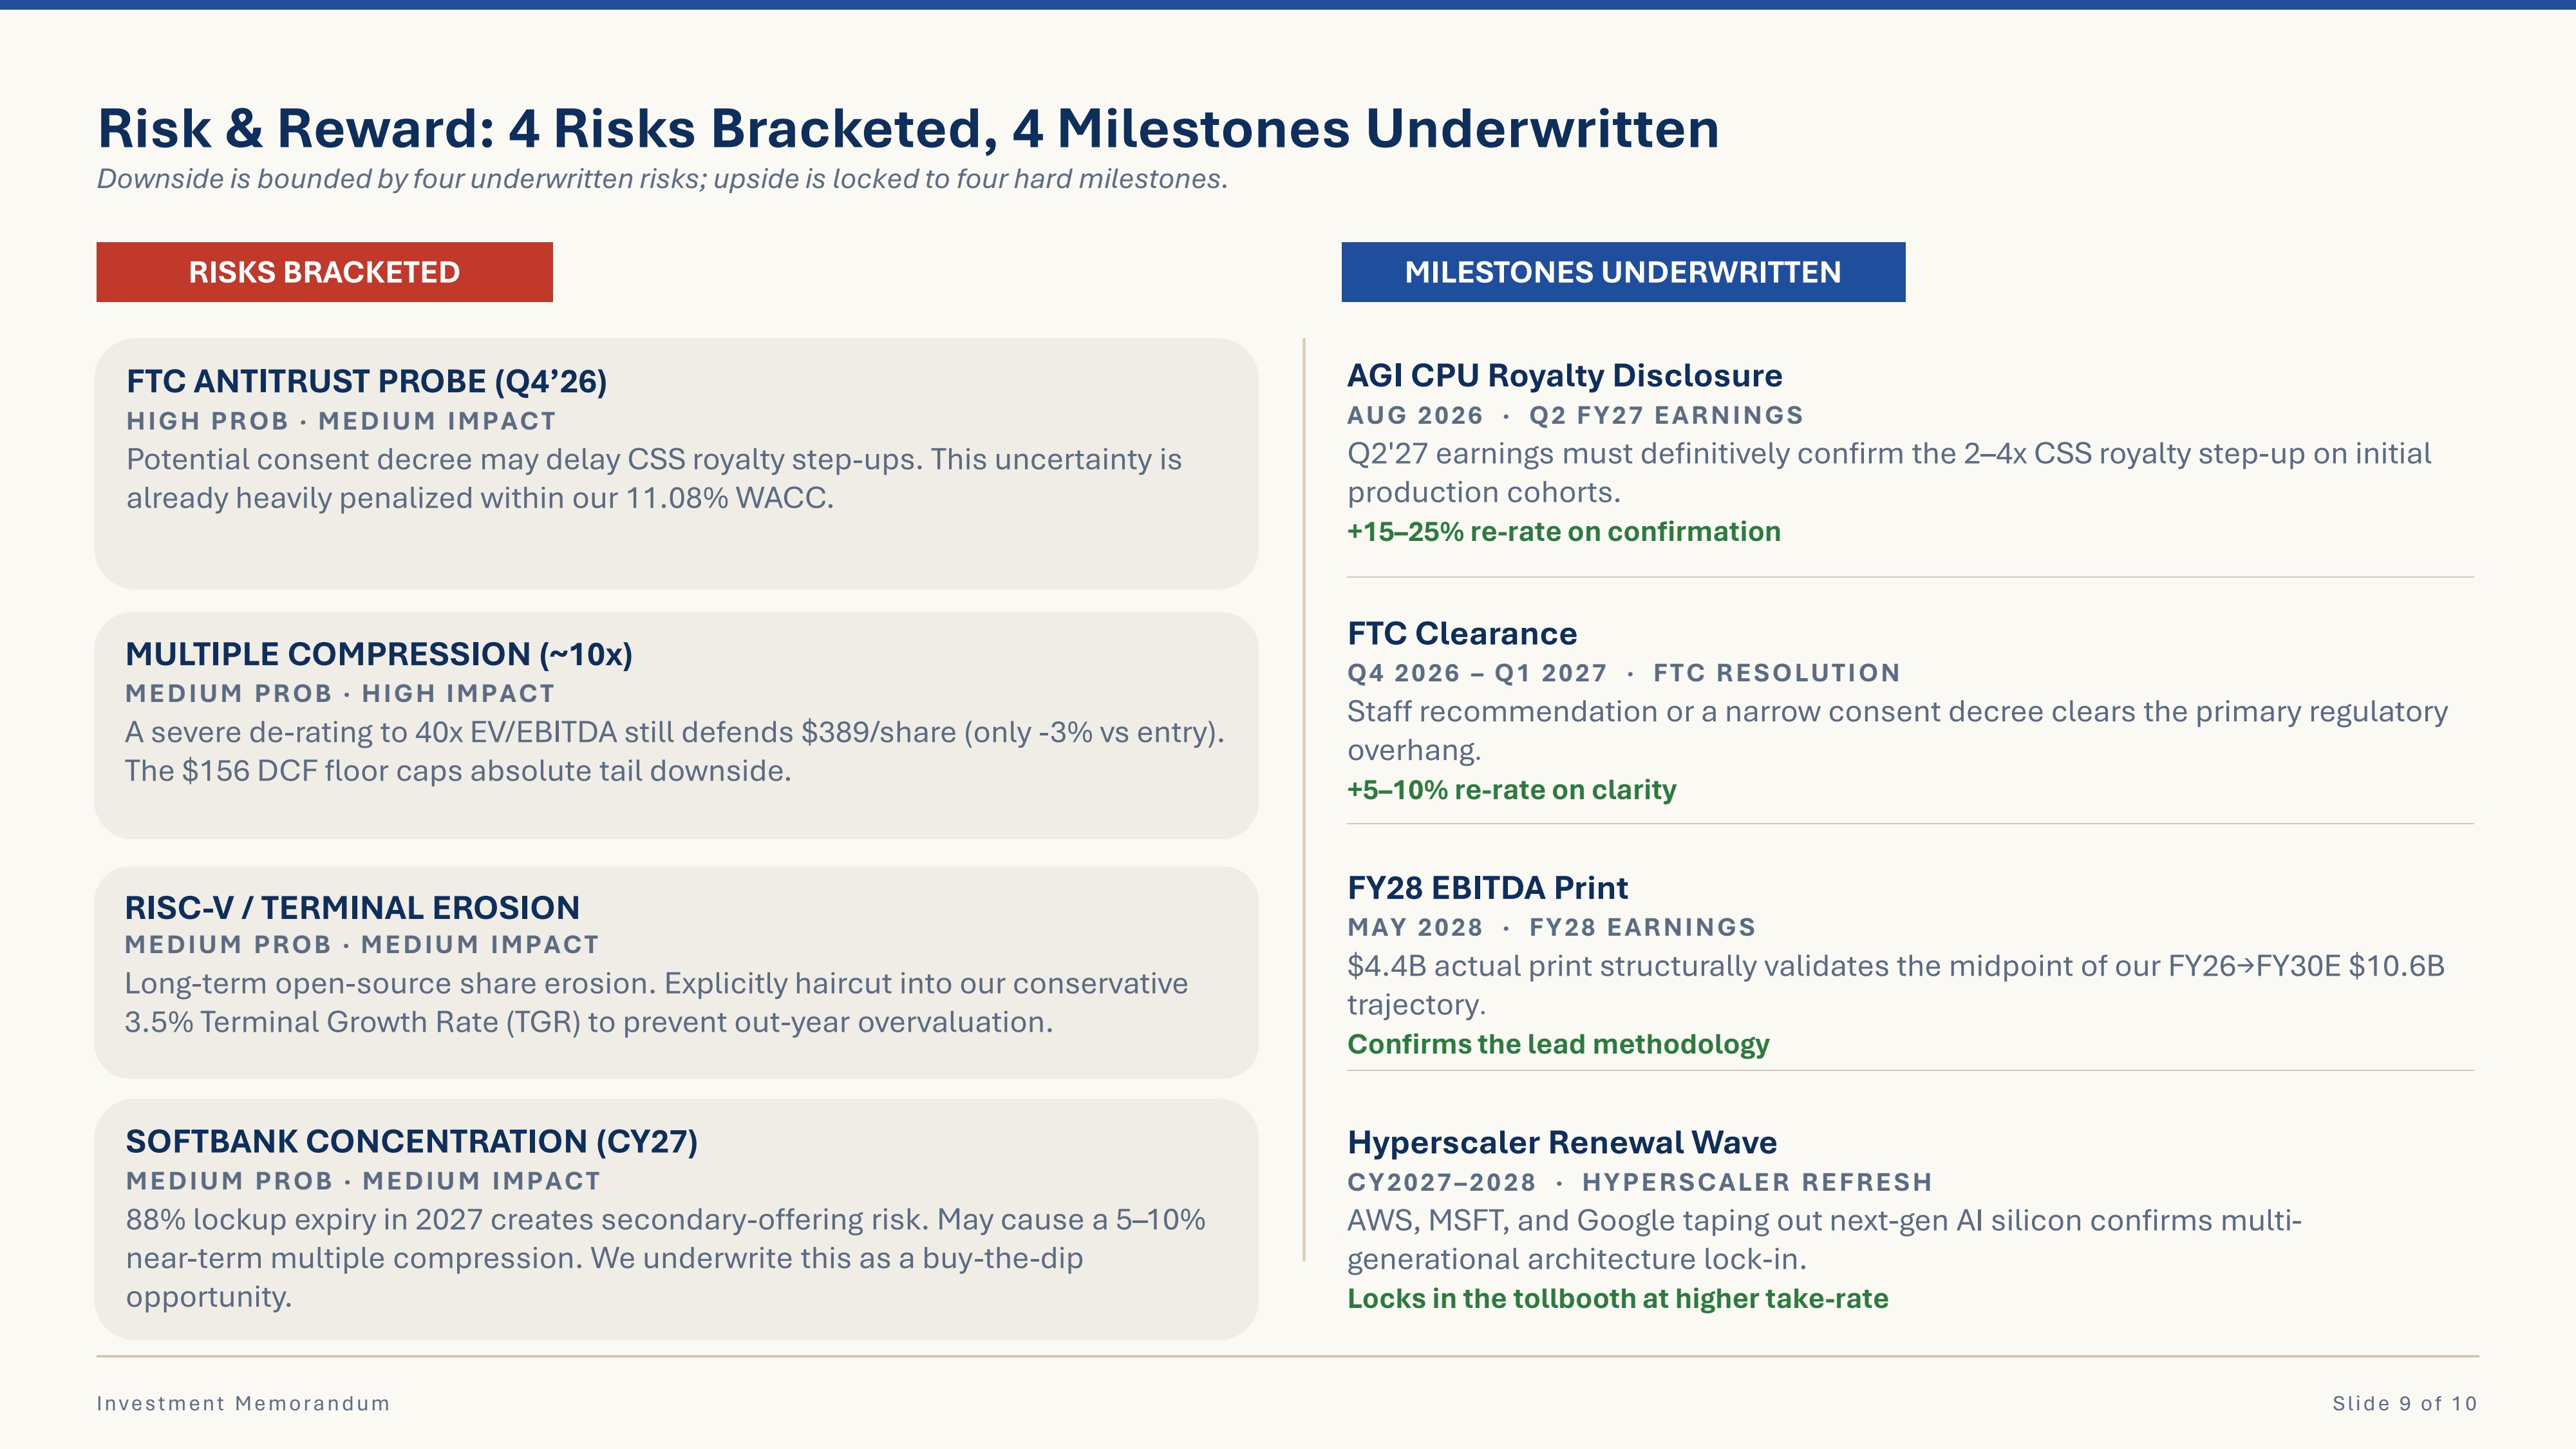
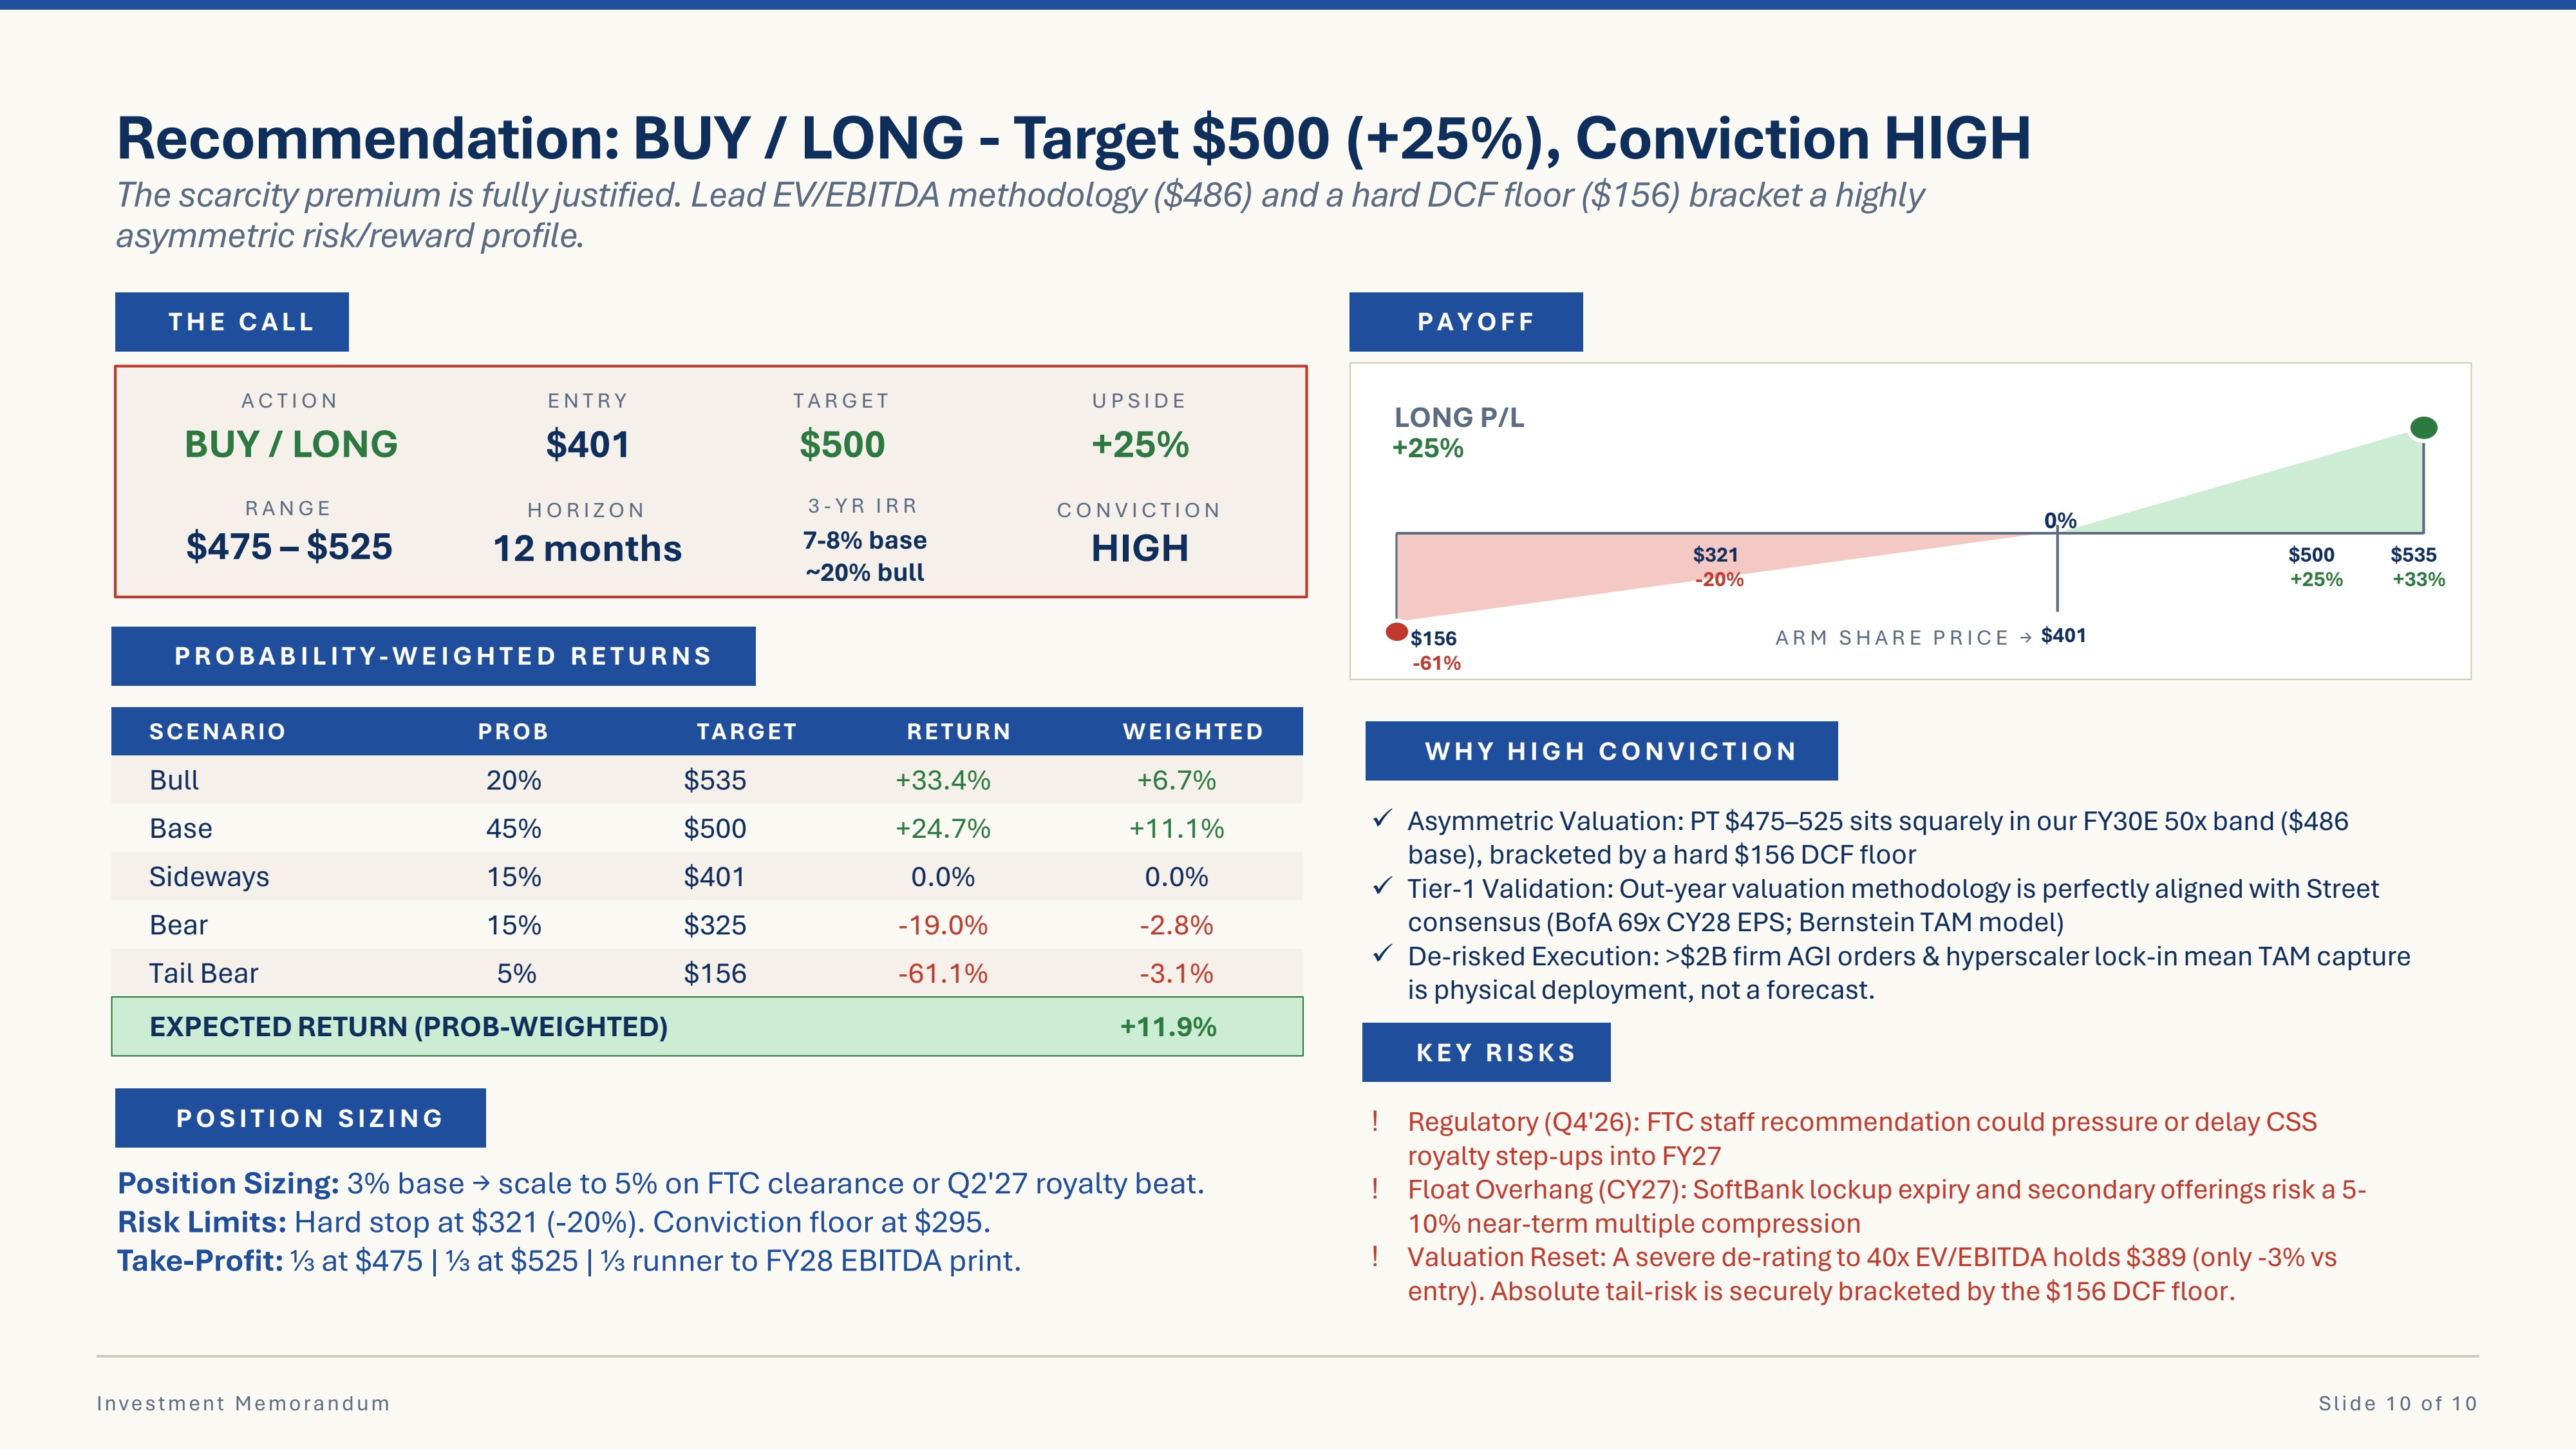
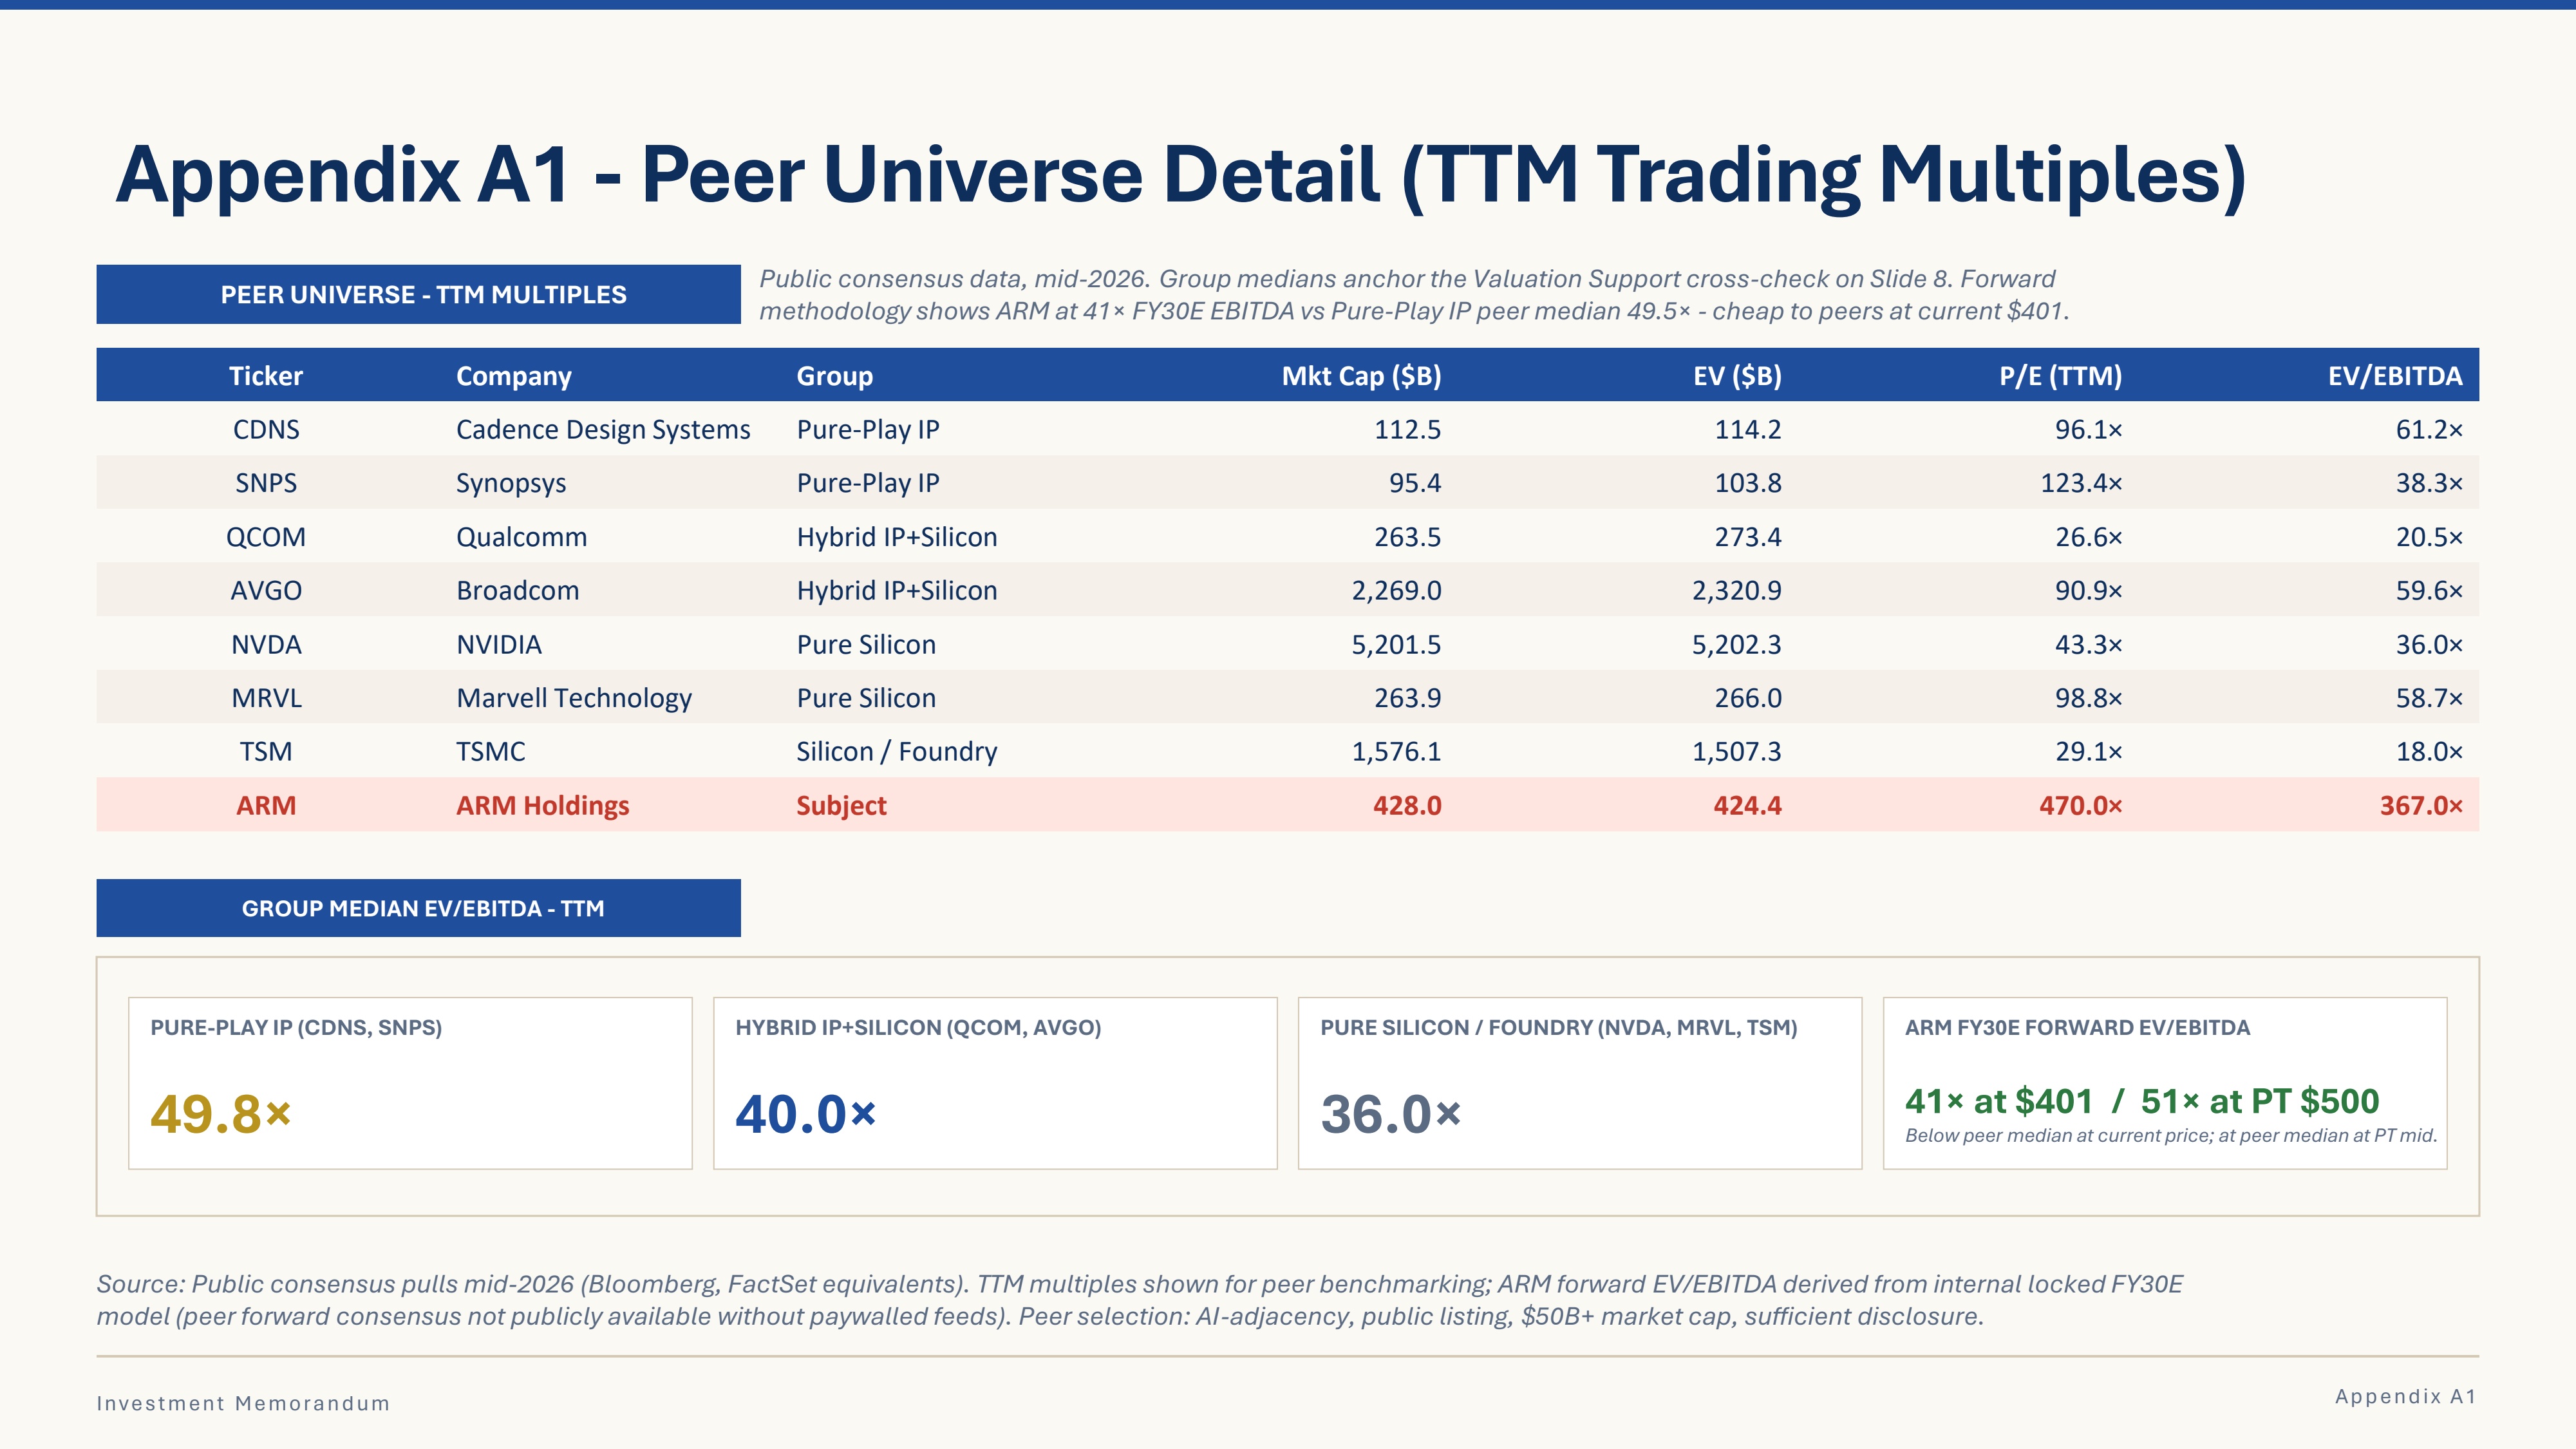
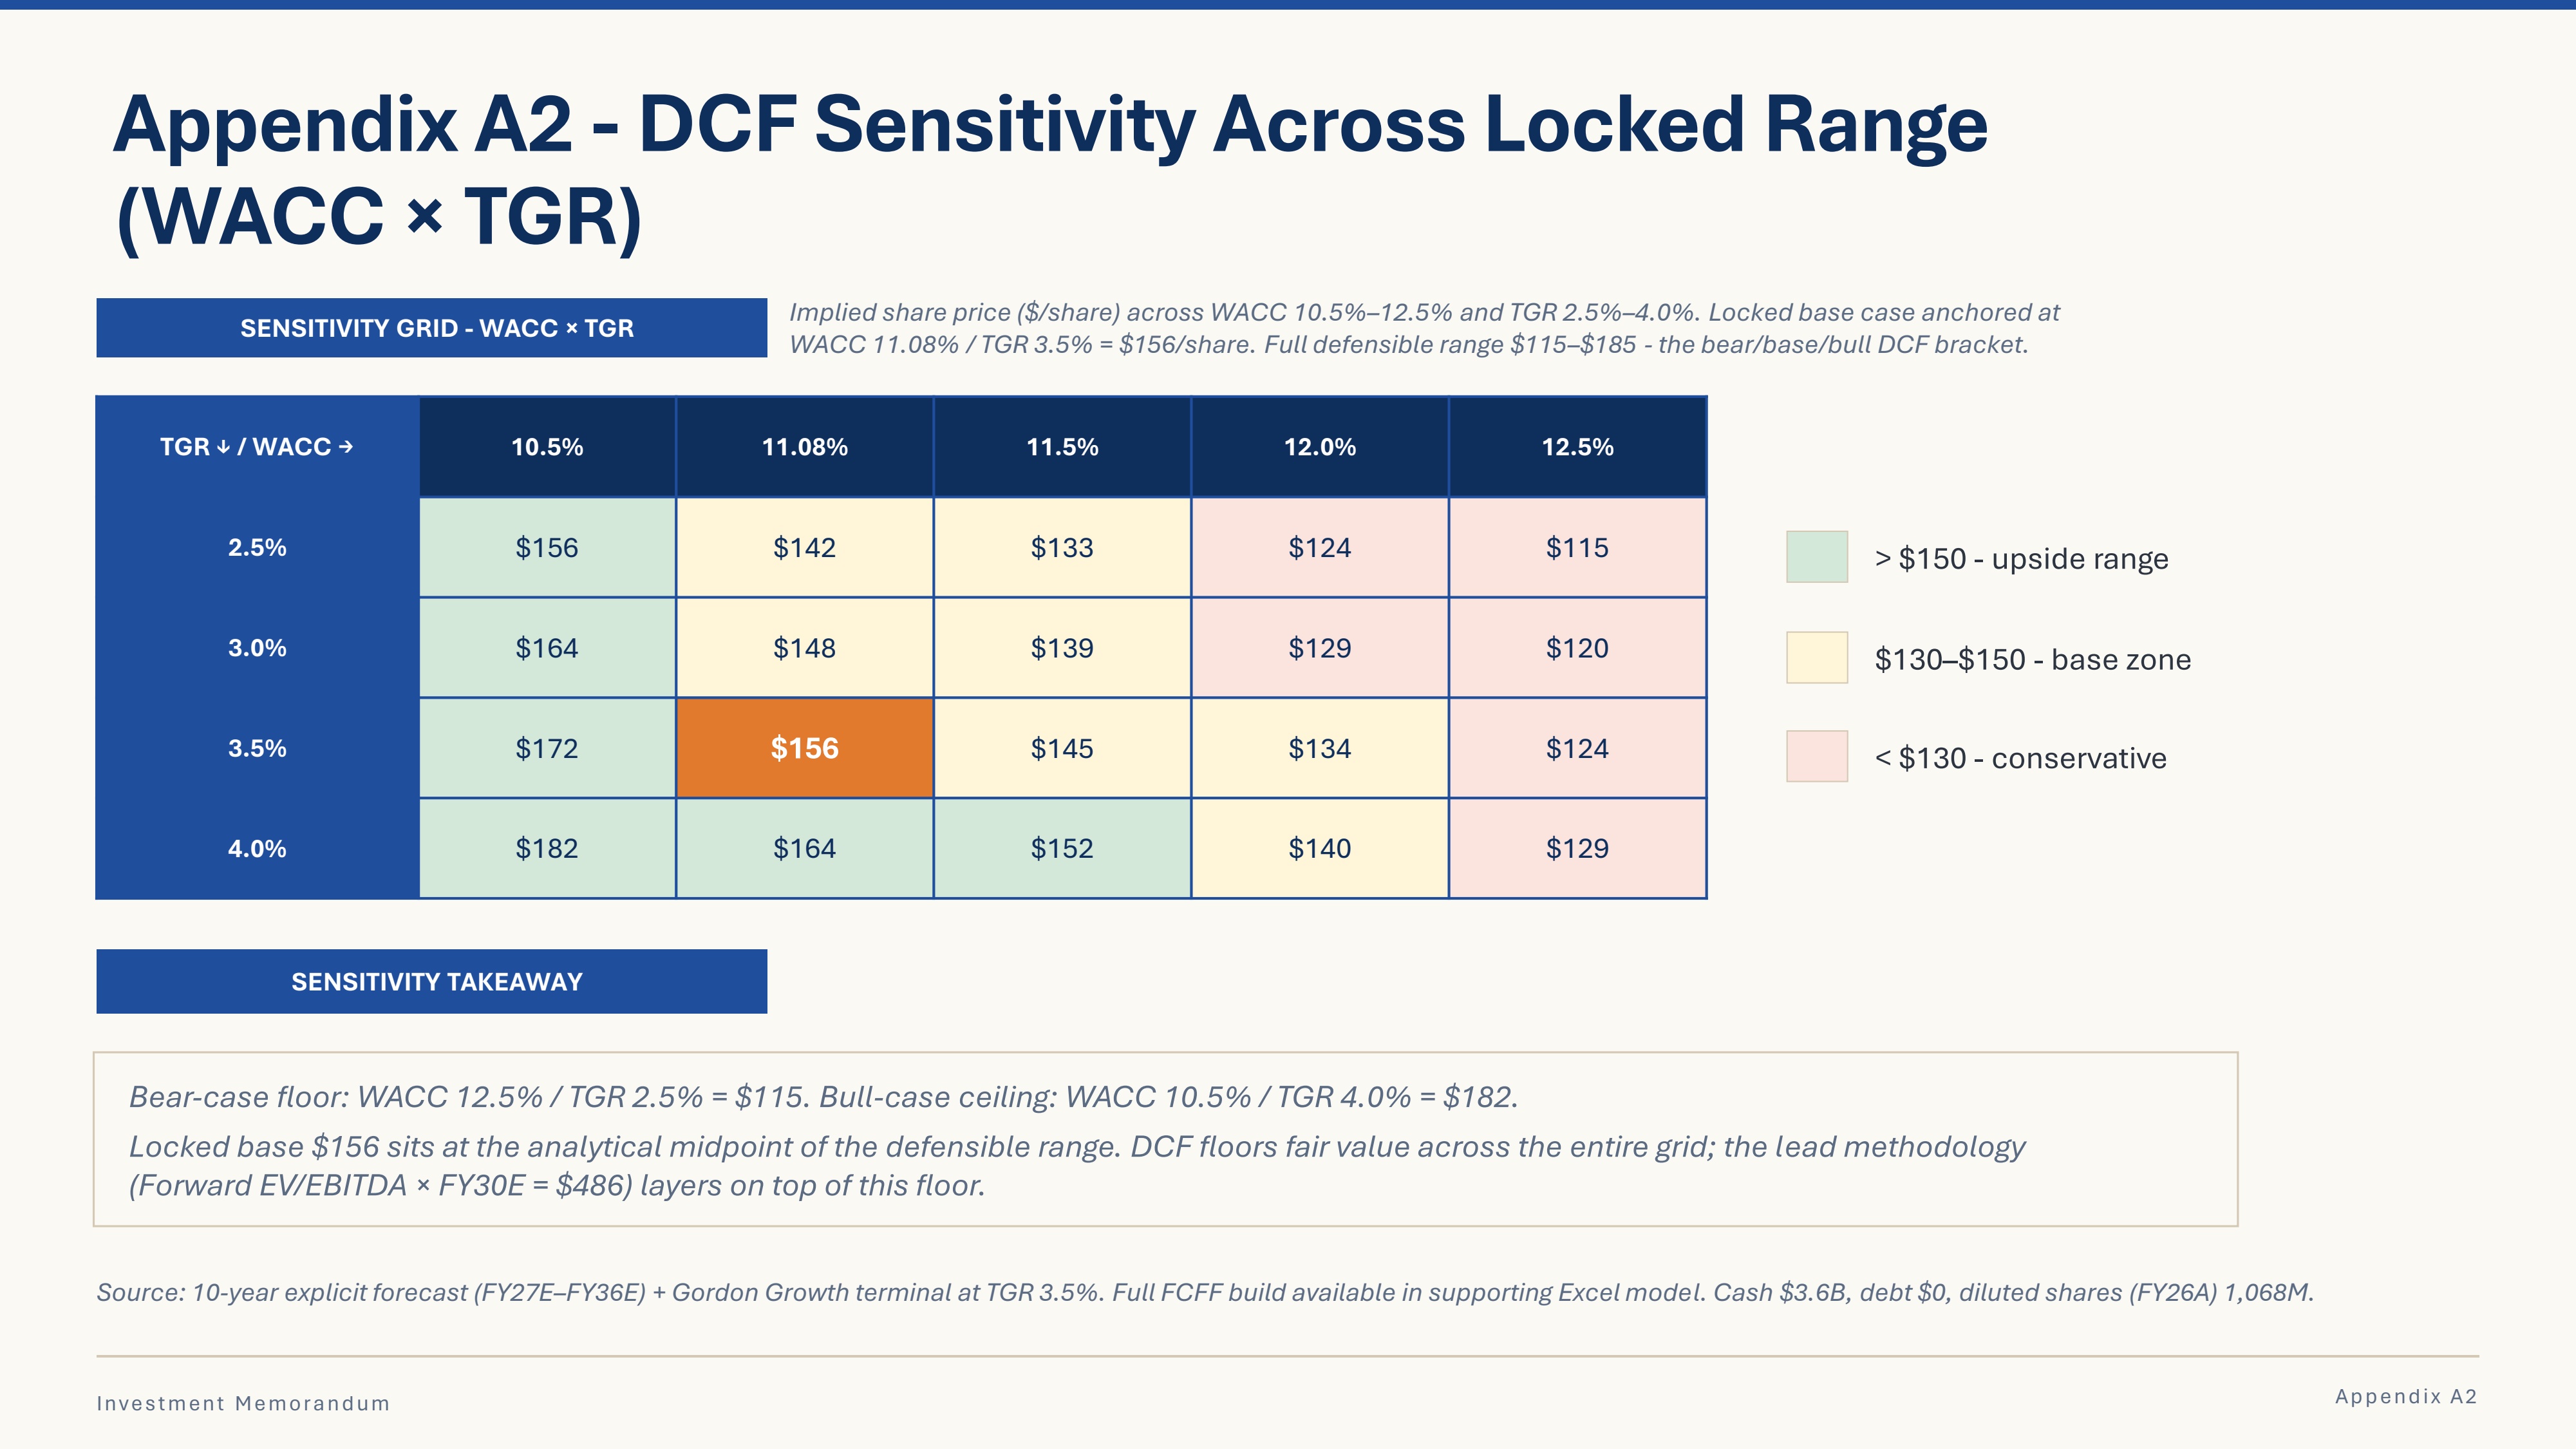
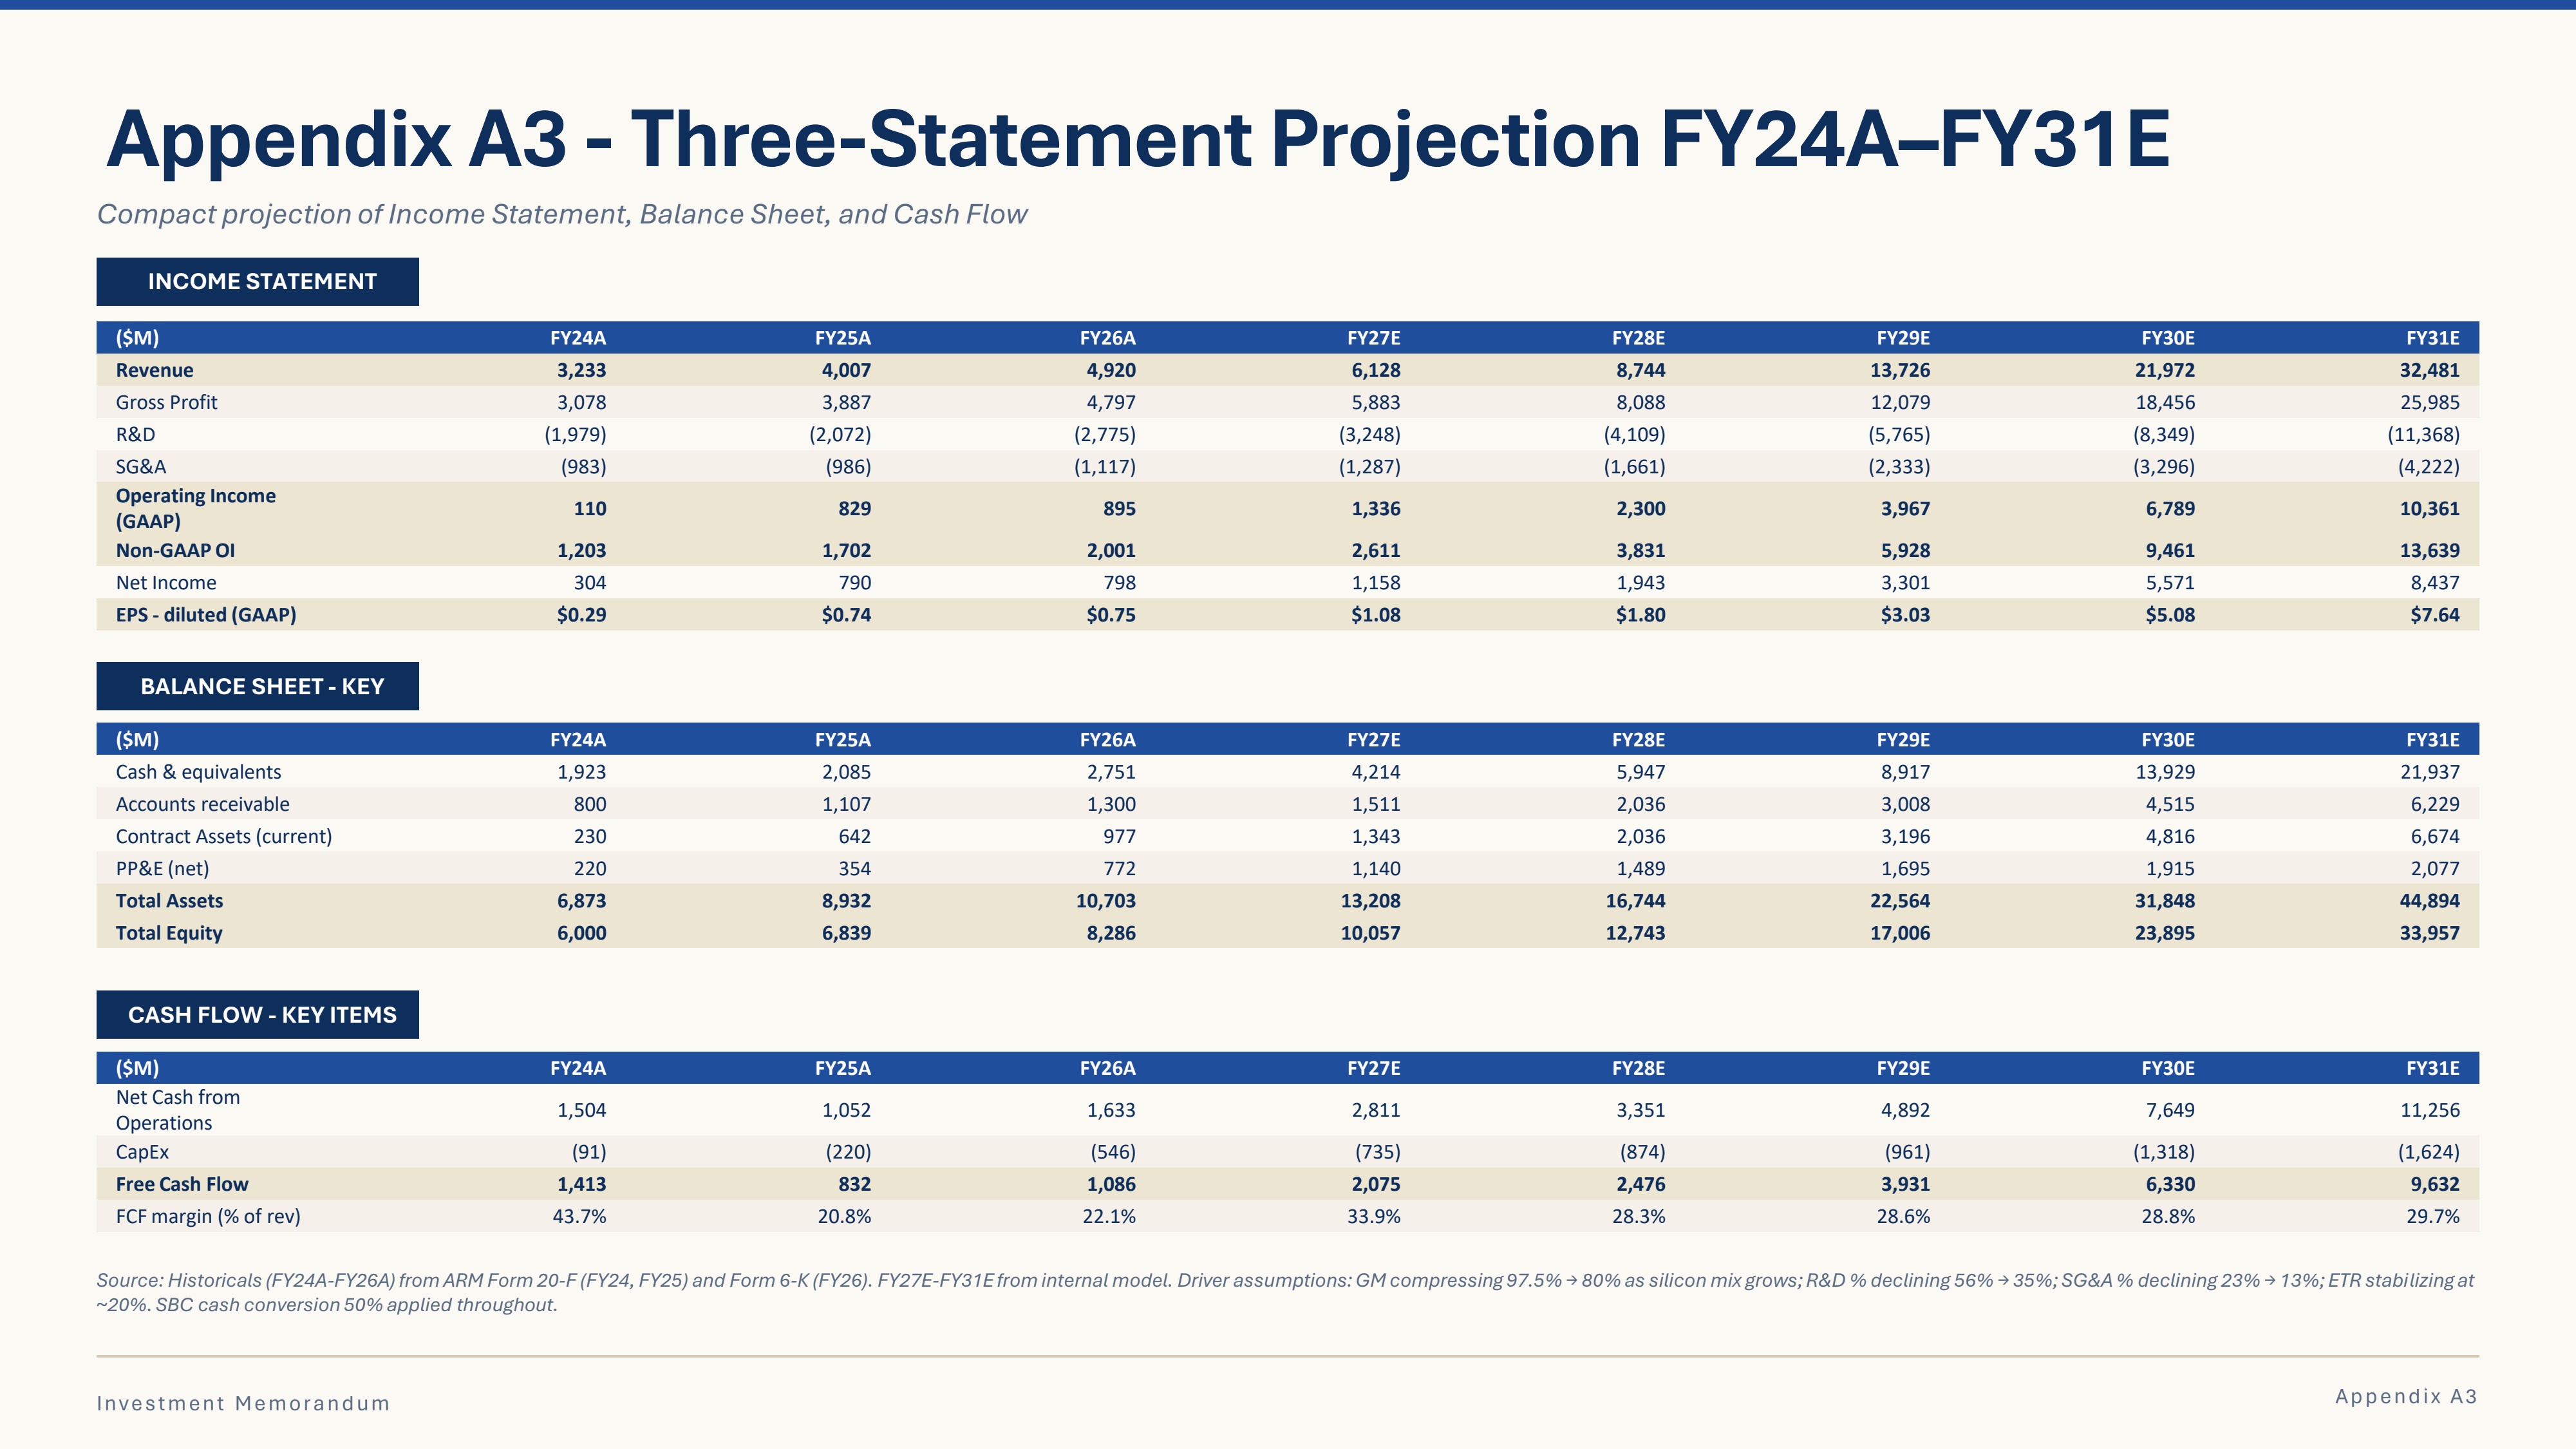
To understand how pros think, the I researched ARM Holdings - the company owning the chip blueprints used in 99% of smartphones and by all major AI giants. Since ARM holds a monopoly on this essential tech, the big question is whether its $401 stock price is a bargain, or if Wall Street is underestimating its power in the AI revolution.

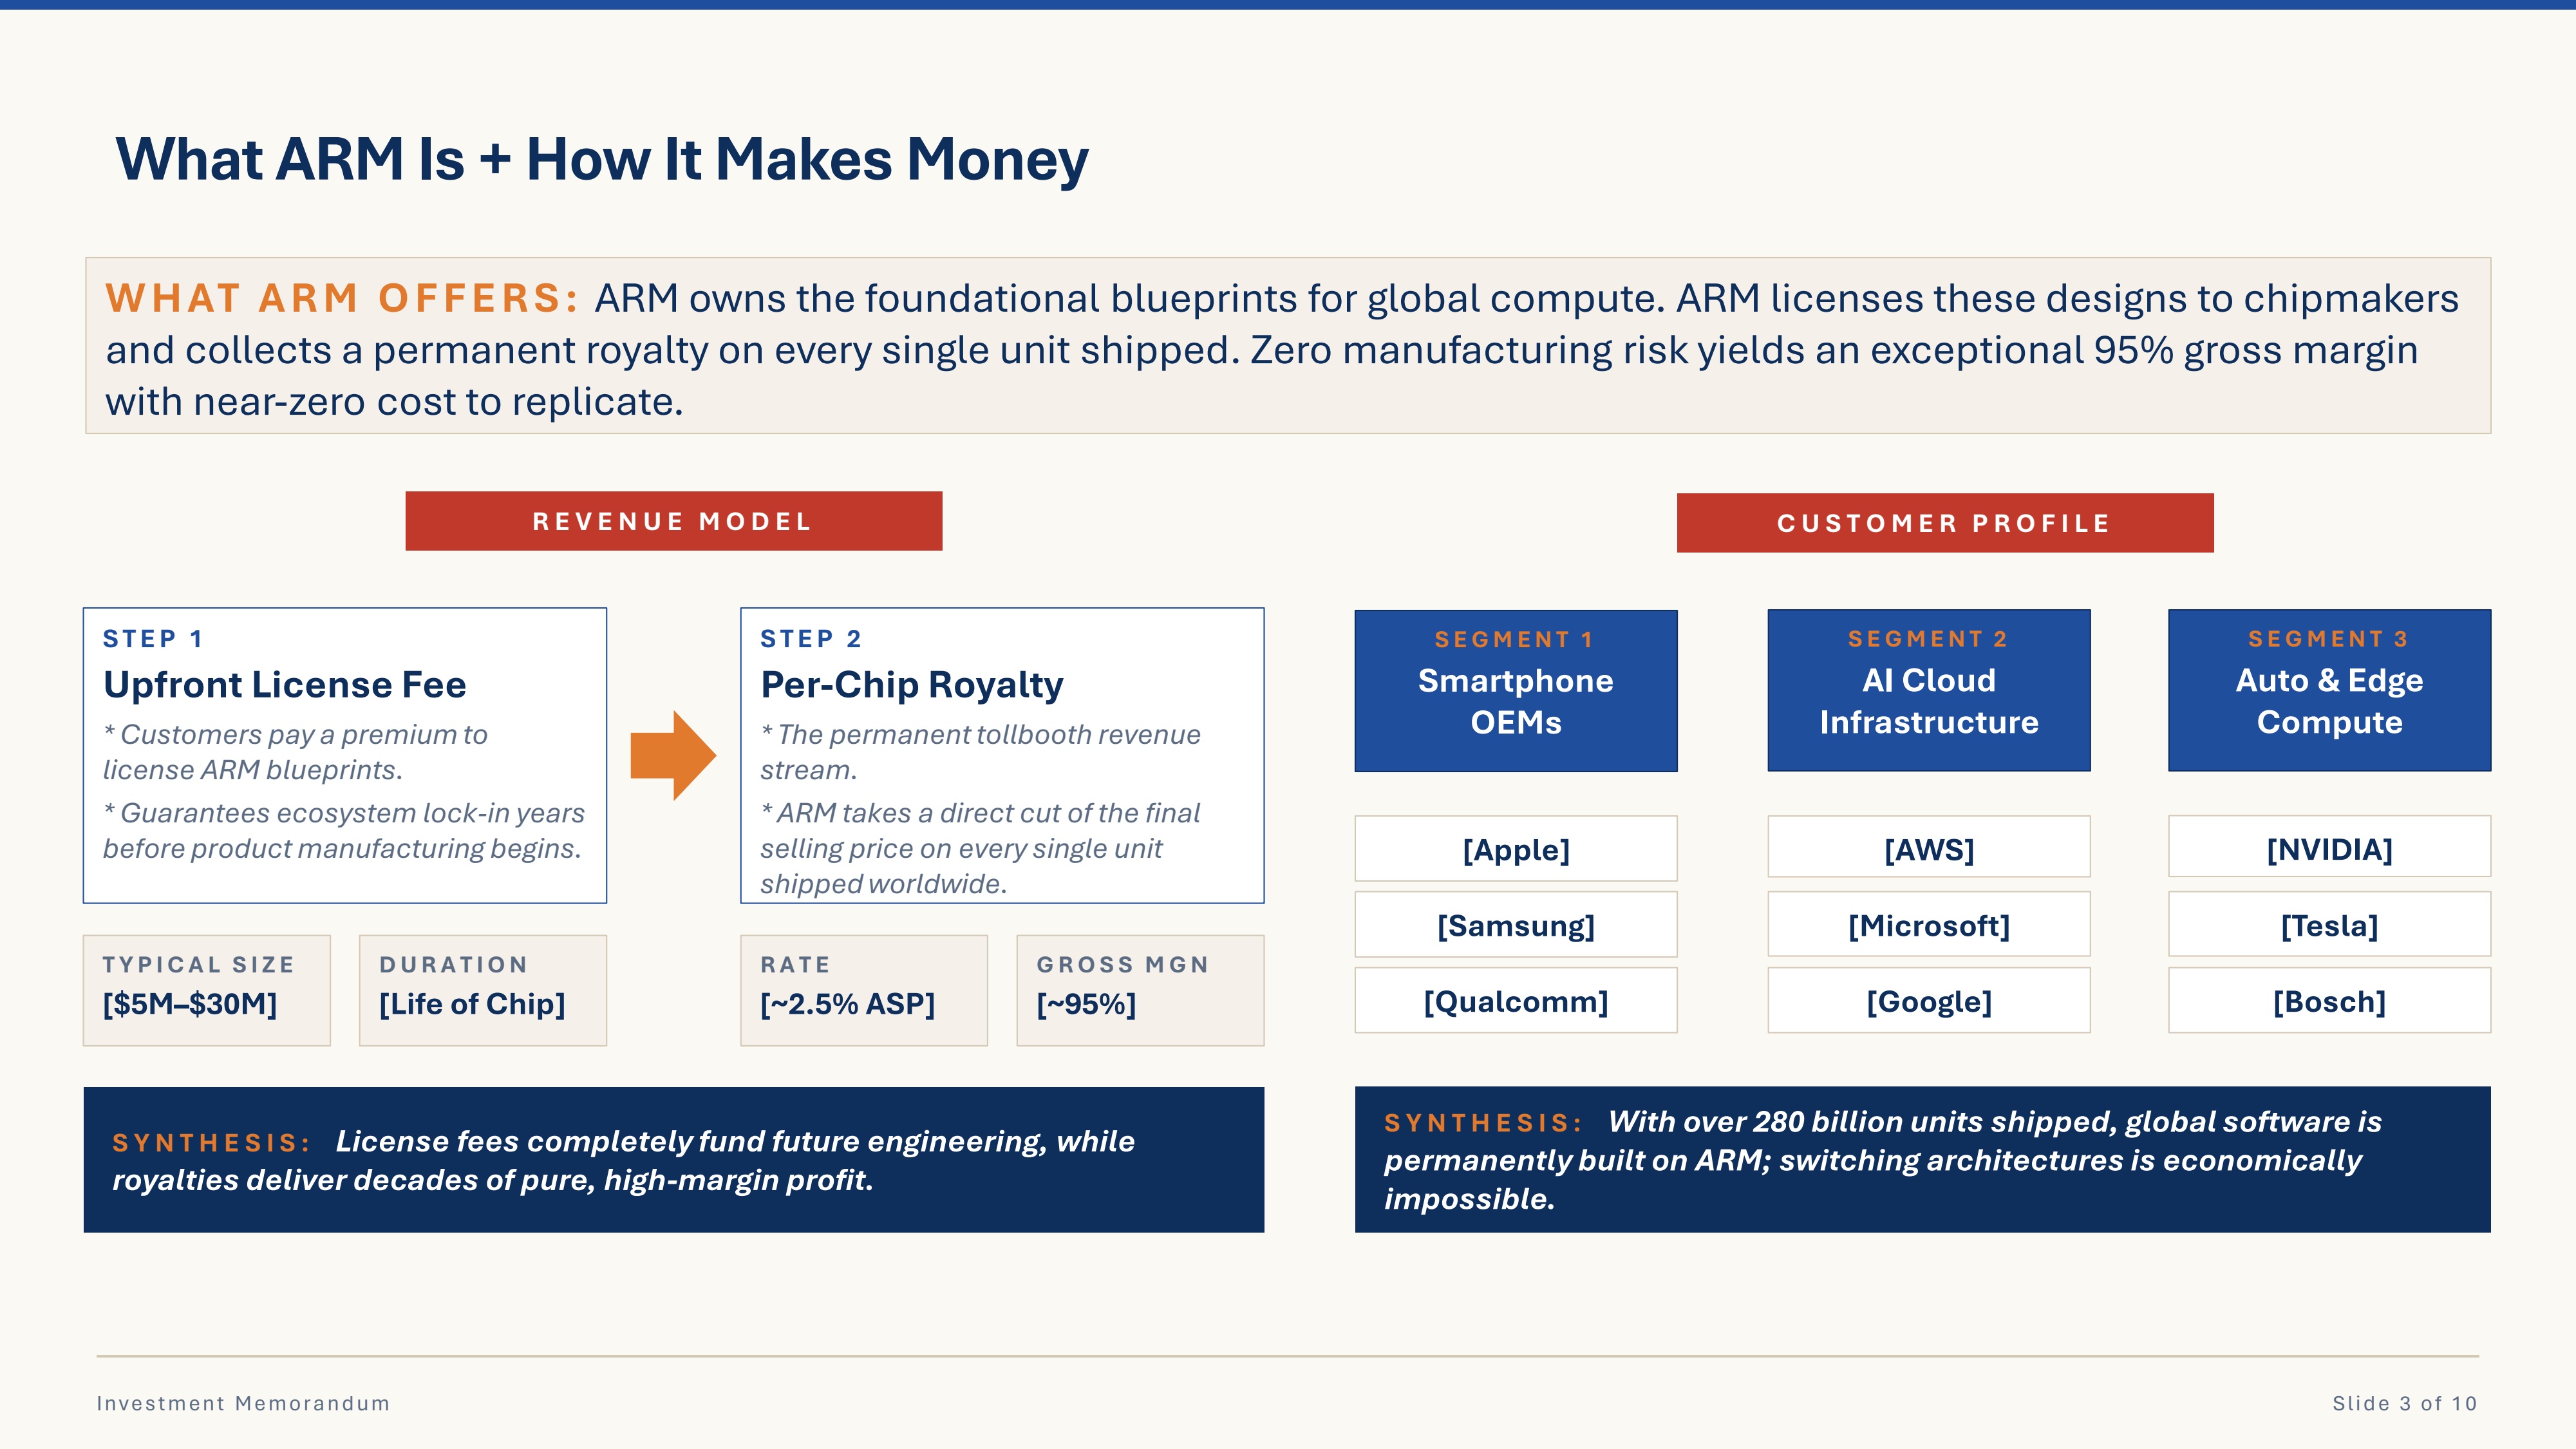
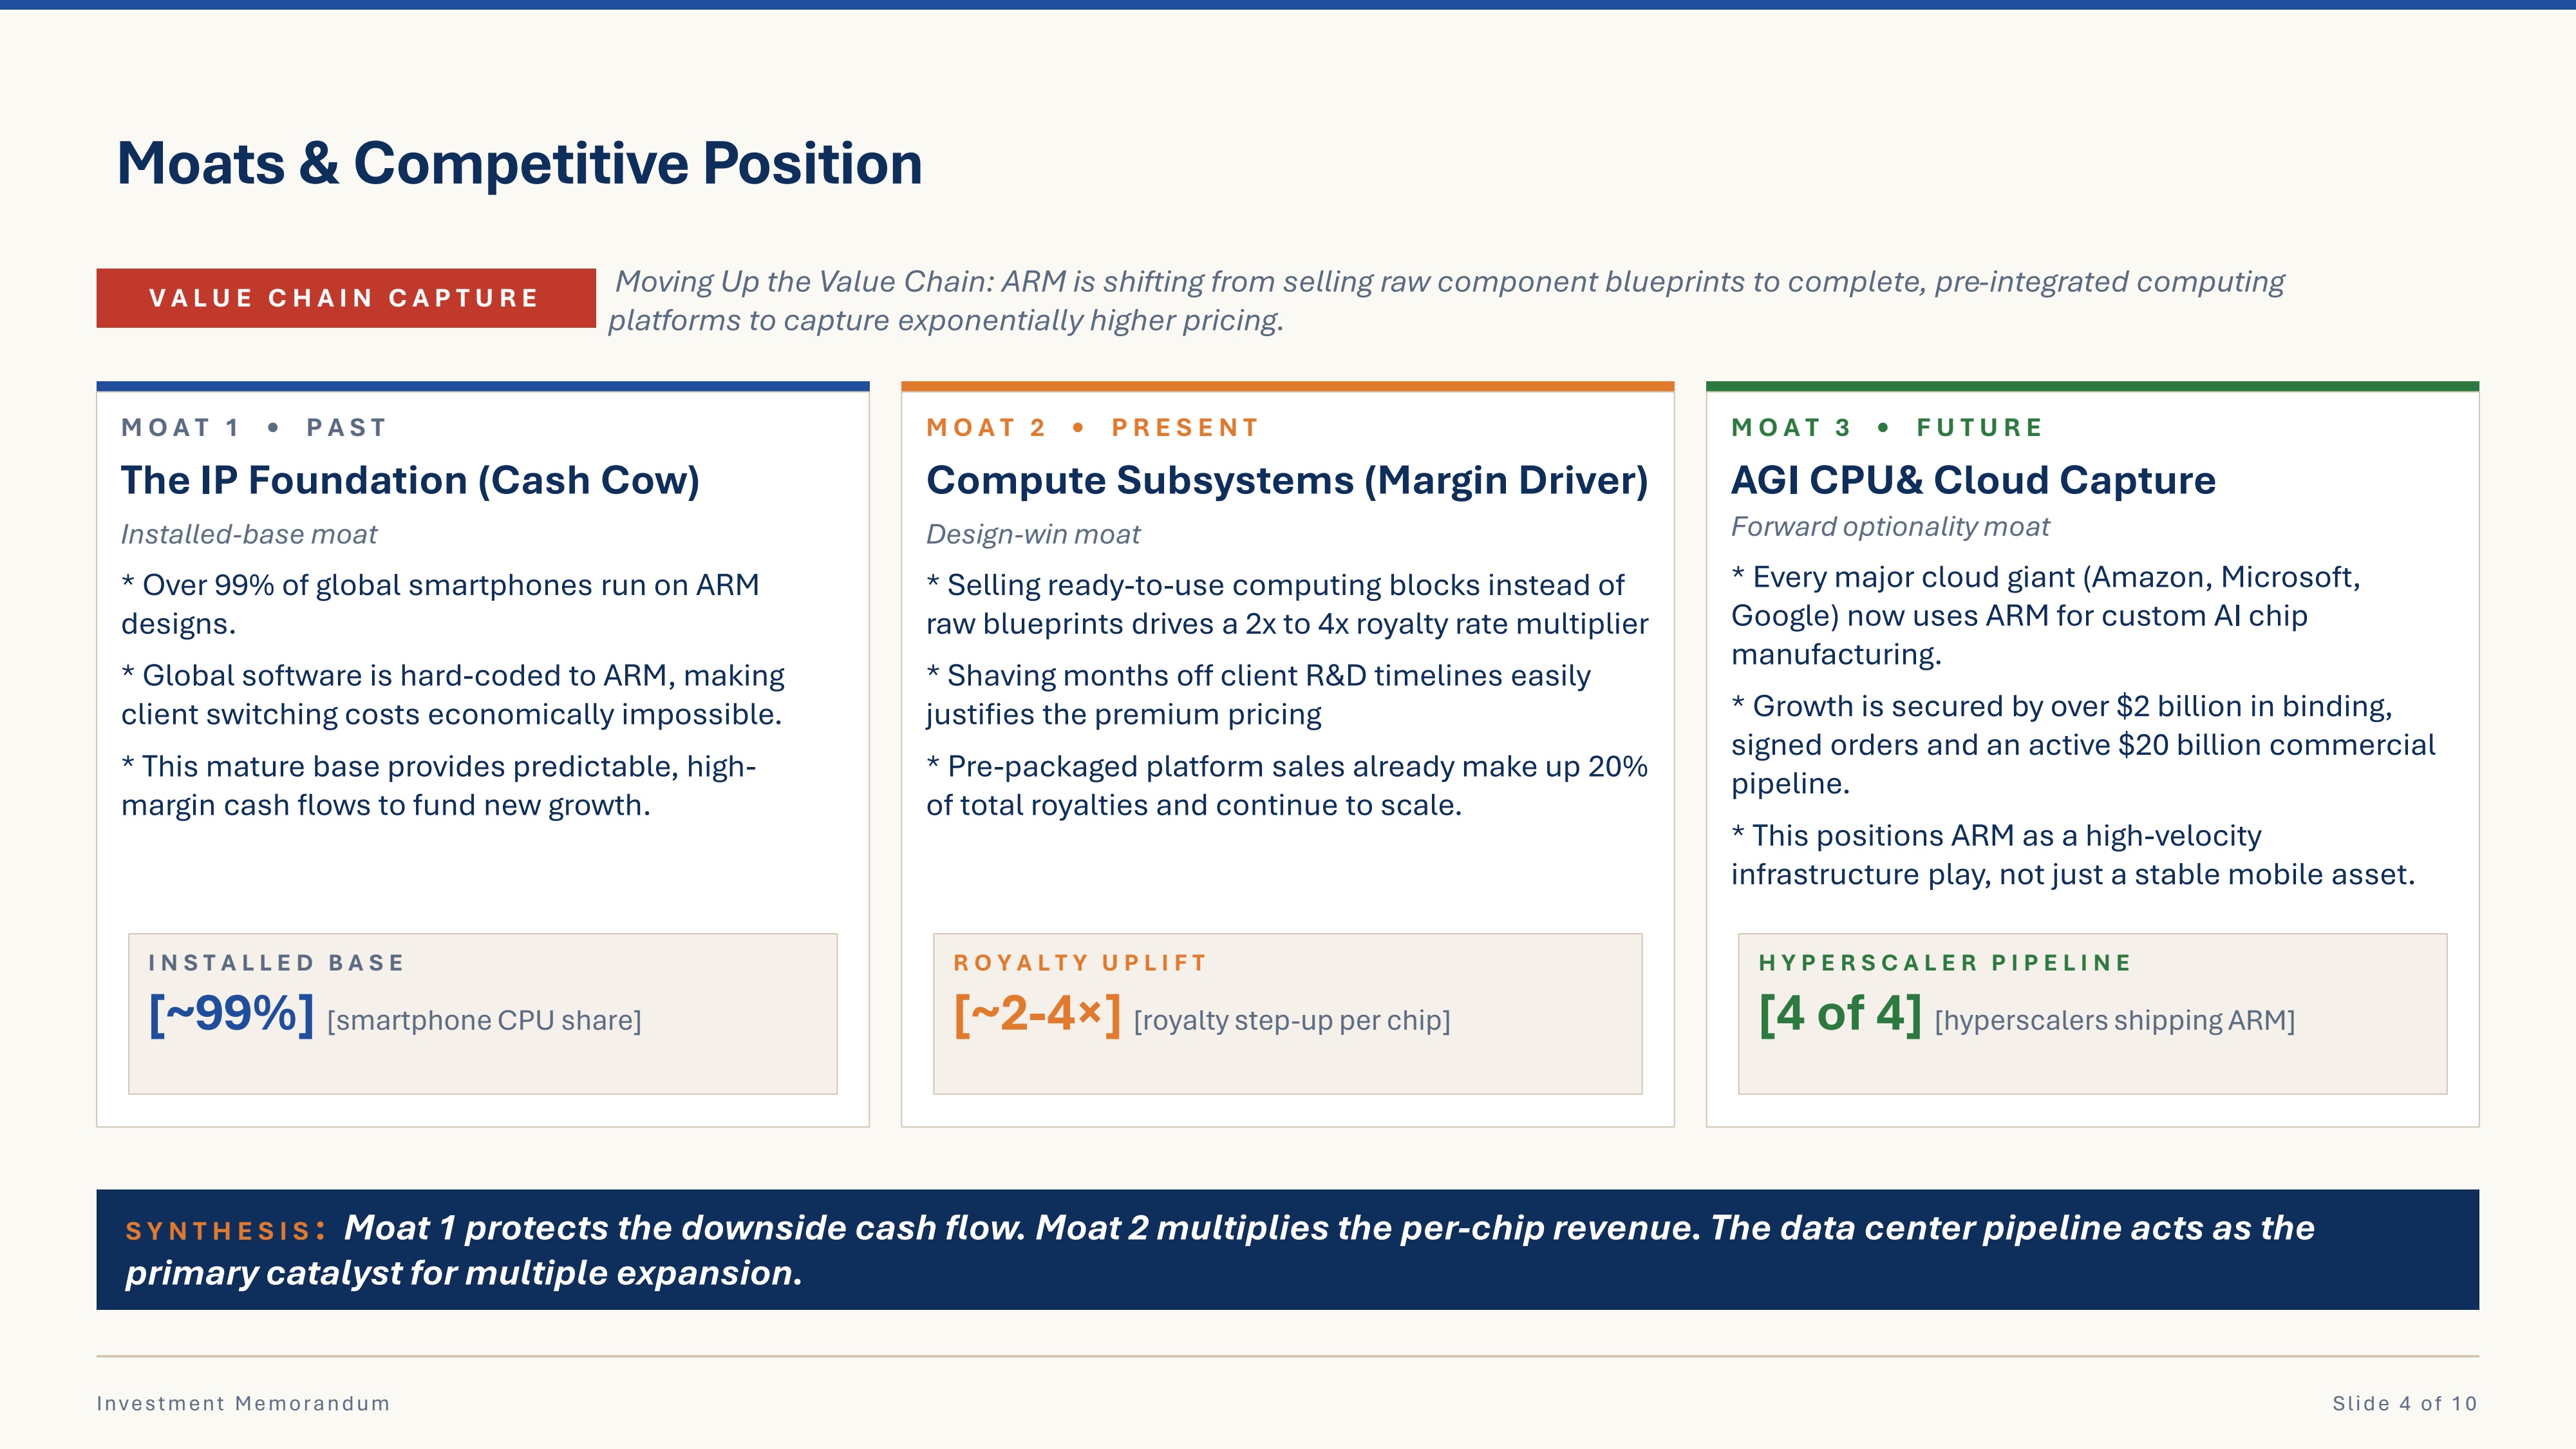
A 10-slide investment memorandum building out a BUY/LONG thesis on ARM Holdings with a $475–$525 price target (vs market $401). The memo walks through the royalty business model, three layers of competitive moats, AI data center market sizing, full FY26–FY31E financial projections, forward EV/EBITDA valuation cross-checked by a 10-year DCF, and a probability-weighted scenario framework with position sizing.
Building the model that backs it up is another.
So here's another case study where I build a full 3-statement model from a blank workbook.
A different company, line by line:
Detailed structural frameworks for valuation and forecasting
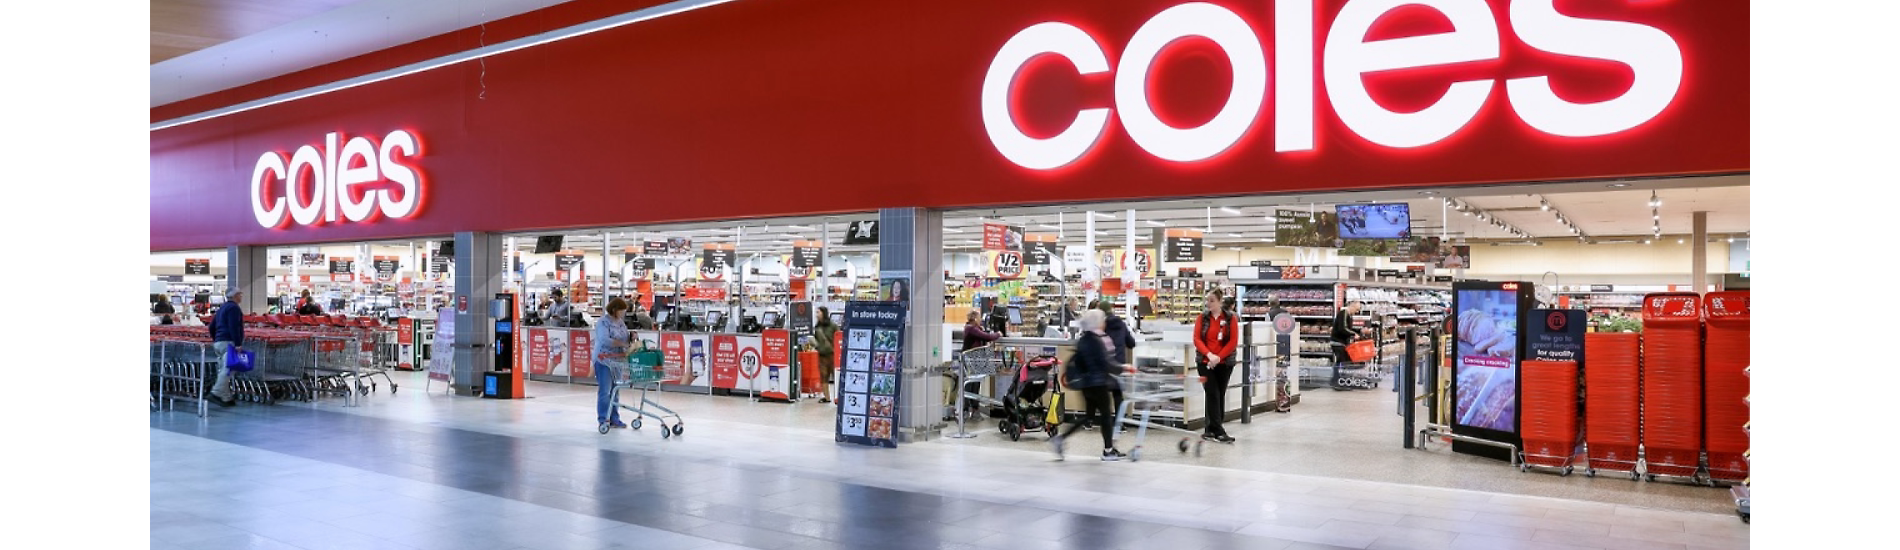
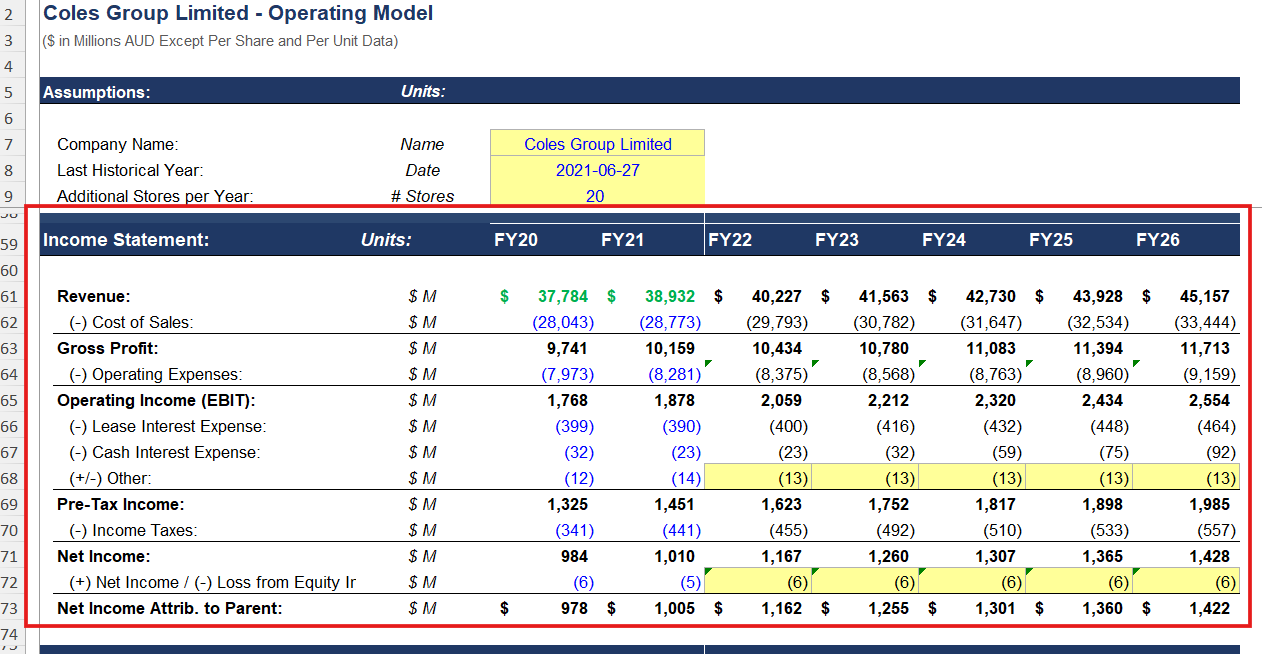
To understand how a company is valued, you have to build the model yourself. So I built a 3-statement model for Coles Group - Australia's second-largest grocery retailer. The goal was to answer one investment question: Does Coles deliver a 15% return and double capital over five years?
A comprehensive 3-statement financial model dissecting the FY21 performance of Coles Group. The study encompasses detailed historical analysis, operational driver forecasting, and full integration across the income statement, balance sheet, and cash flow, culminating in an enterprise valuation and sensitivity analysis.
Starting point: Annual Report — the source document for revenue, segment data, and CapEx figures.
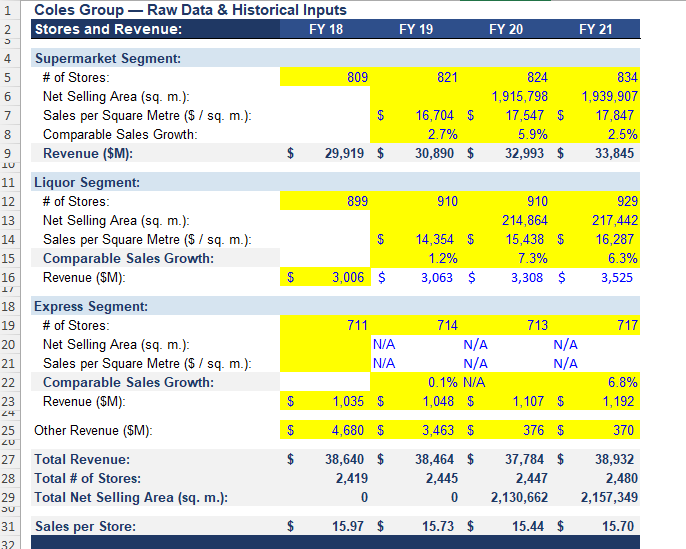
Extracted and structured in Excel — store counts, revenue by segment, FY18–FY21.
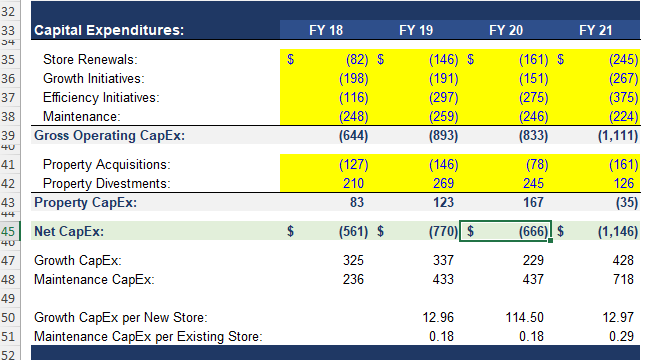
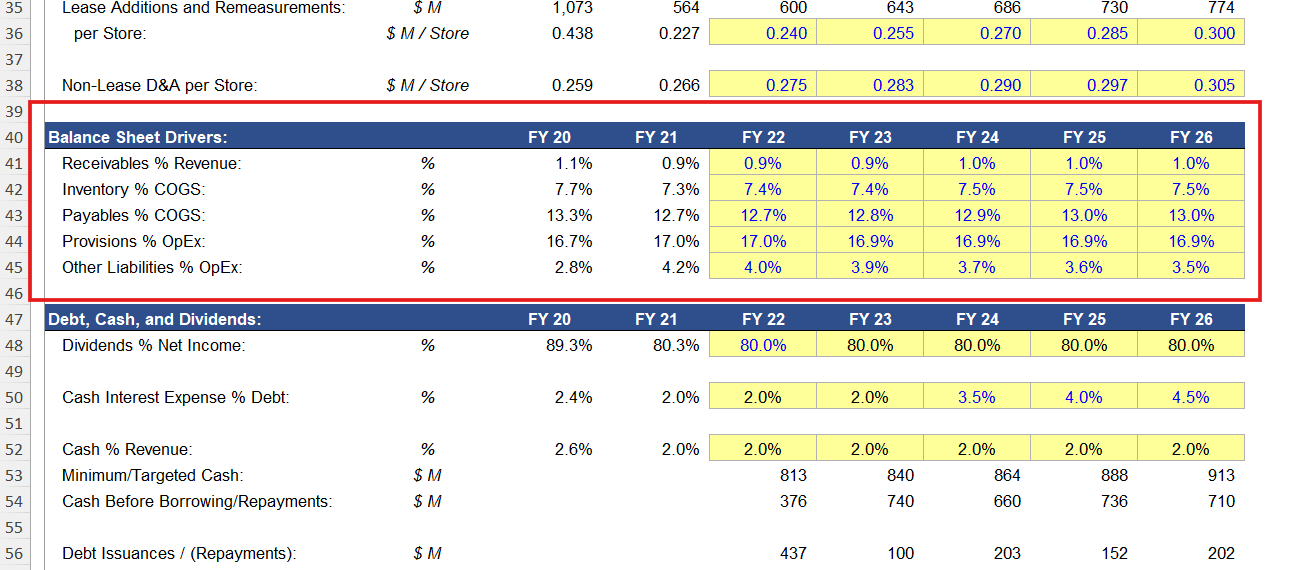
Growth rates, margin benchmarks, and CapEx decomposition (Growth vs. Maintenance) integrated directly into the driver engine.
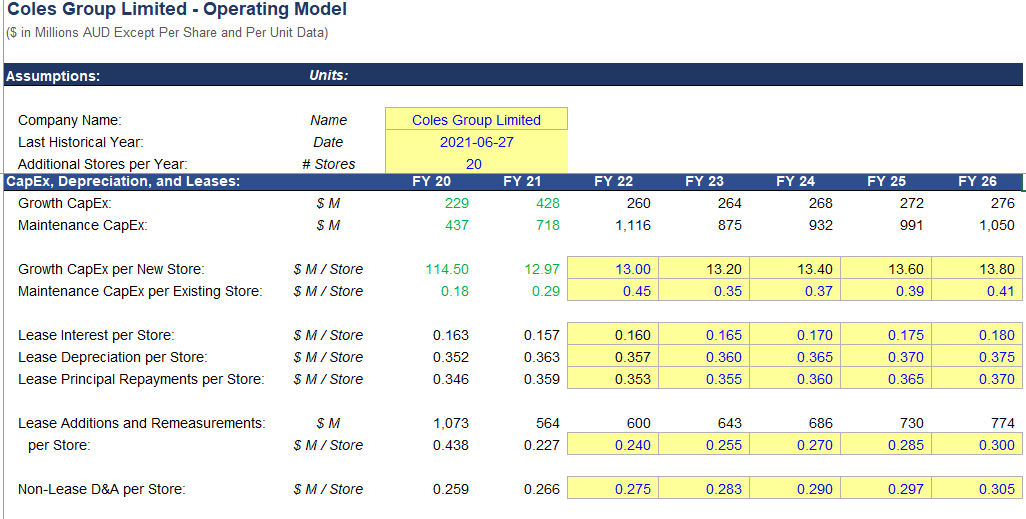
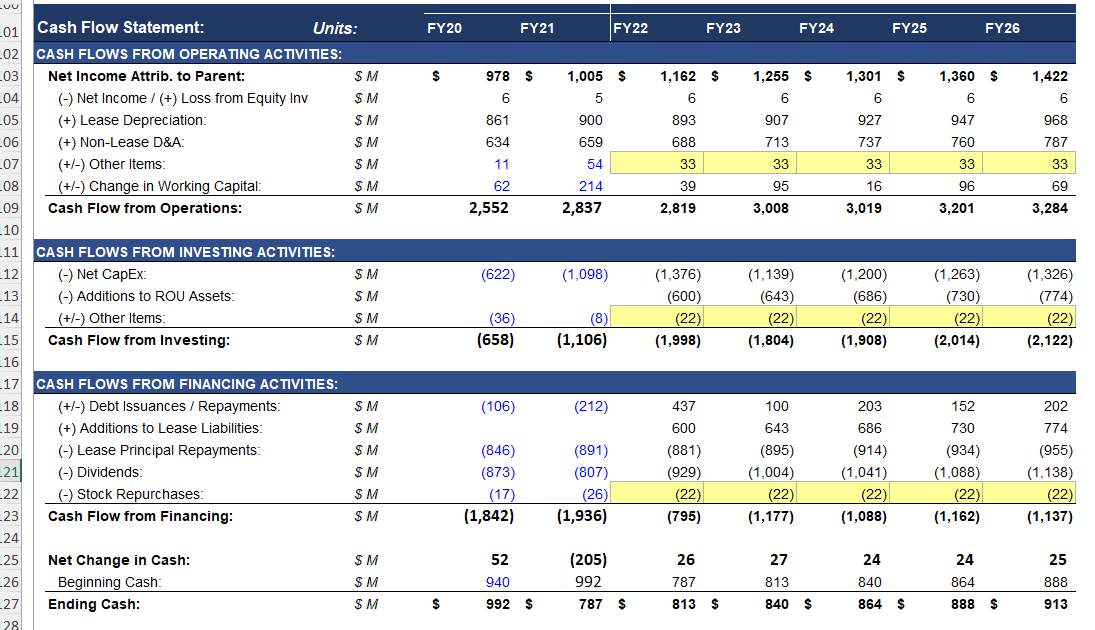
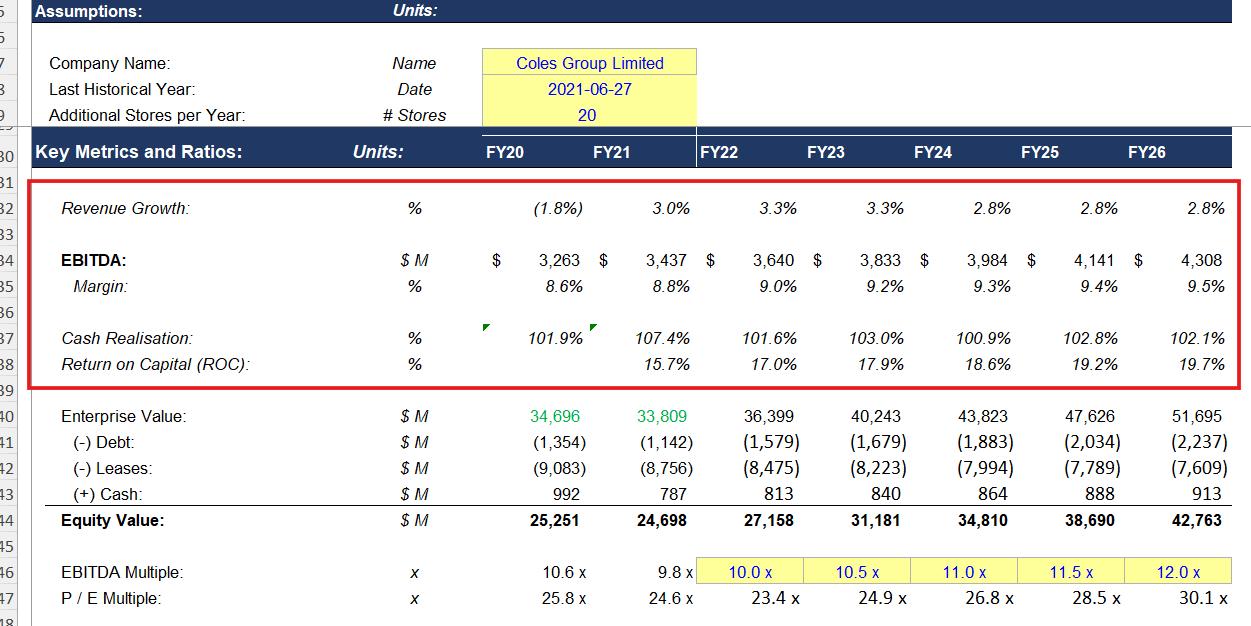
Driver-based forecasting over a 5-year horizon: FY21 historical through FY26 projected.
Store count driver flowing into revenue — 20 new stores per year per management guidance.
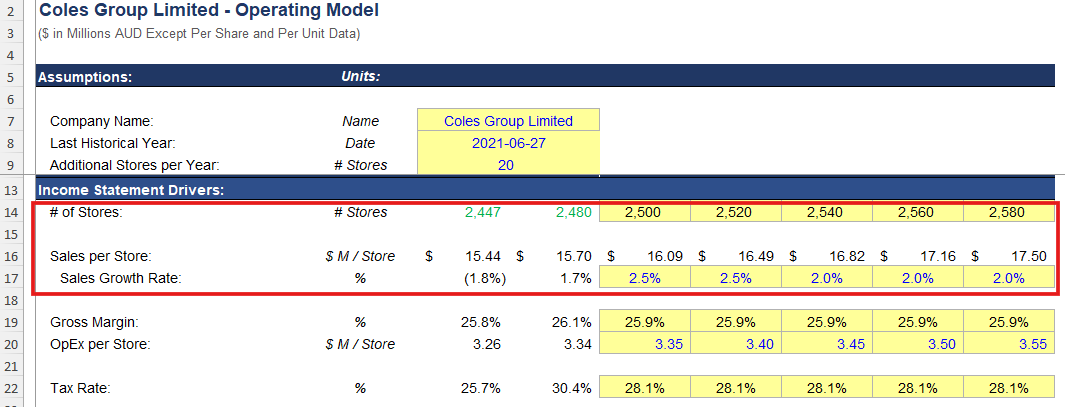
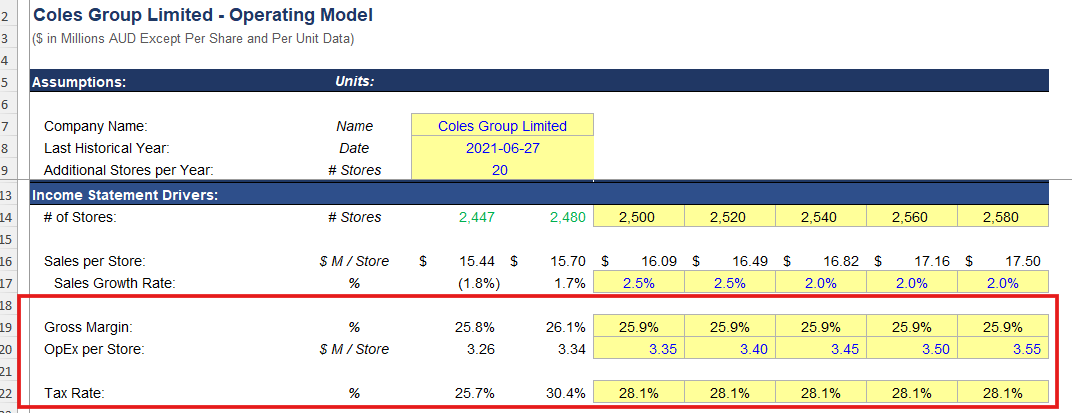
Margin assumptions and OpEx per store focusing on mean reversion to historical averages.
Cross-statement integration: assets, liabilities, and equity tracked across the full projection period.
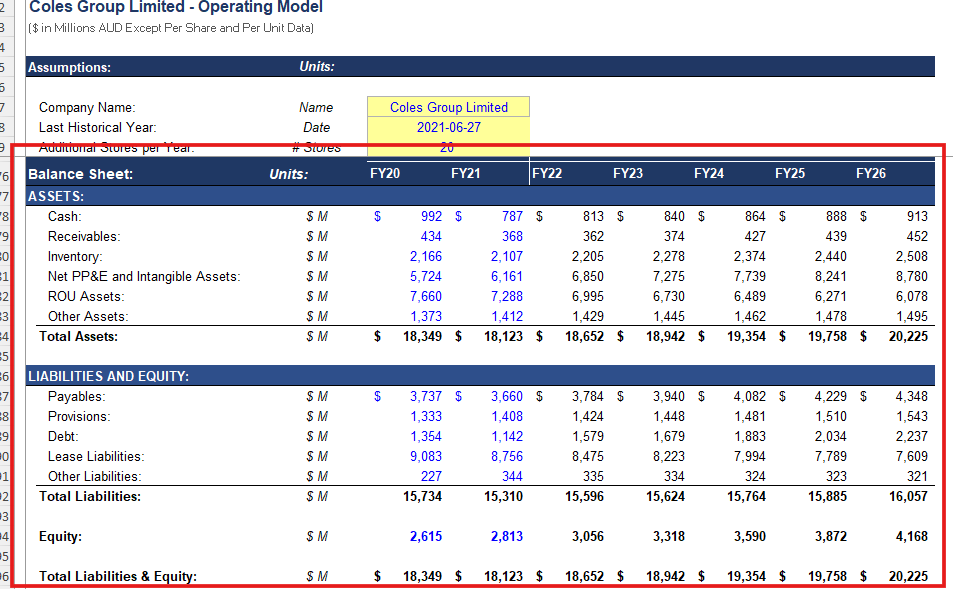
Receivables tied to revenue, inventory and payables structurally tied to COGS.
Working capital ratios and debt structure assumptions driving the balance sheet projection — receivables, inventory, payables, and dividend policy held consistent with historical trends.
FY21 entry at 10x EBITDA, establishing a realistic investment baseline.
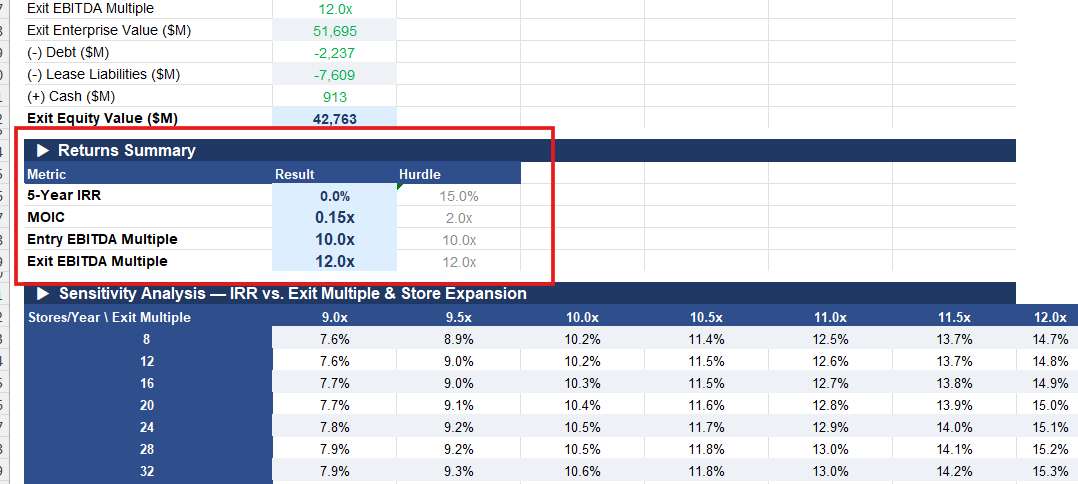
EBITDA × exit multiple, net of debt and leases, bridged directly to equity value.
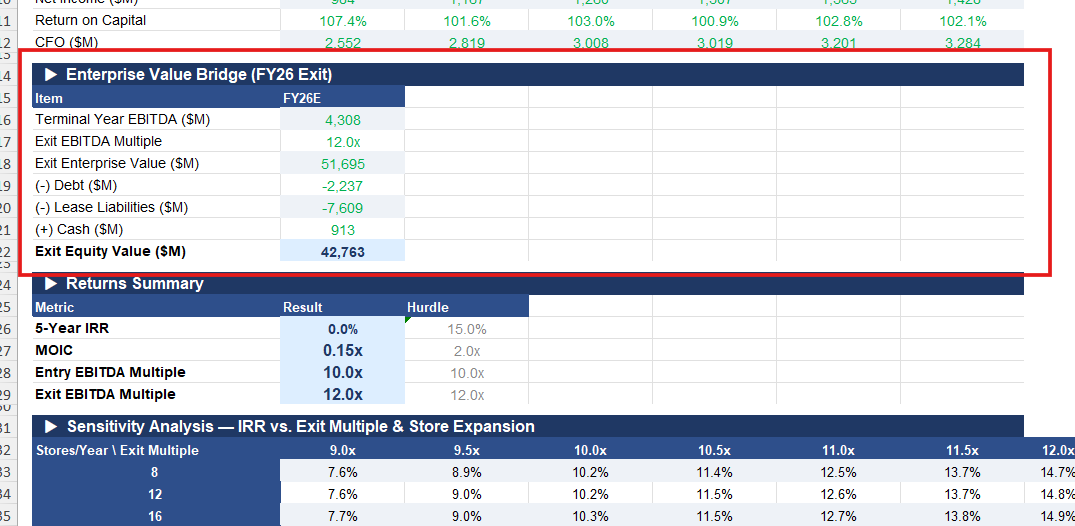
IRR and MOIC sensitivity mapped across store expansion pace and exit multiple variations.
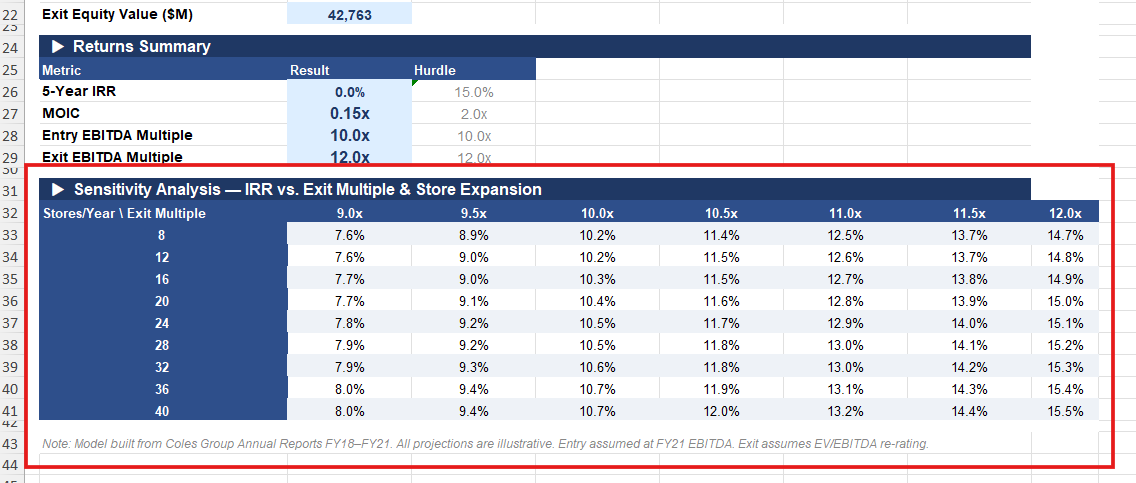
ROC trajectory analysis — showing an improvement from 15.7% toward 20% over the holding period.
The other half is understanding how a business actually runs.
During my internships, I saw a common problem:
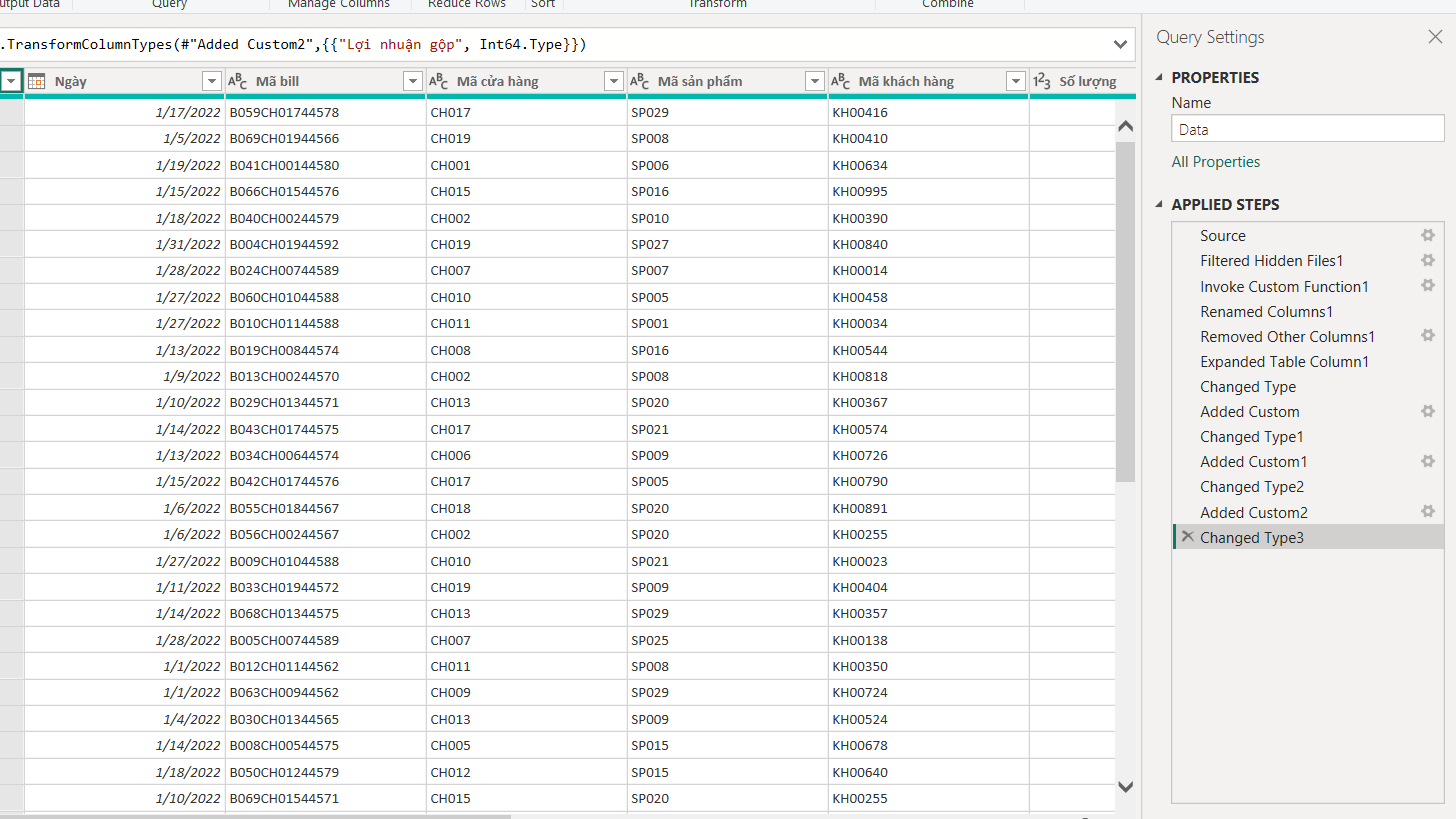
Most company's financial data was raw, messy, and unusable without hours of manual work.
So I learned the tools to fix it:
High-fidelity data visualization for executive oversight
I use Power Query to clean and structure the raw accounting data, And Power BI to turn it into interactive reports to help with the decision-makings:
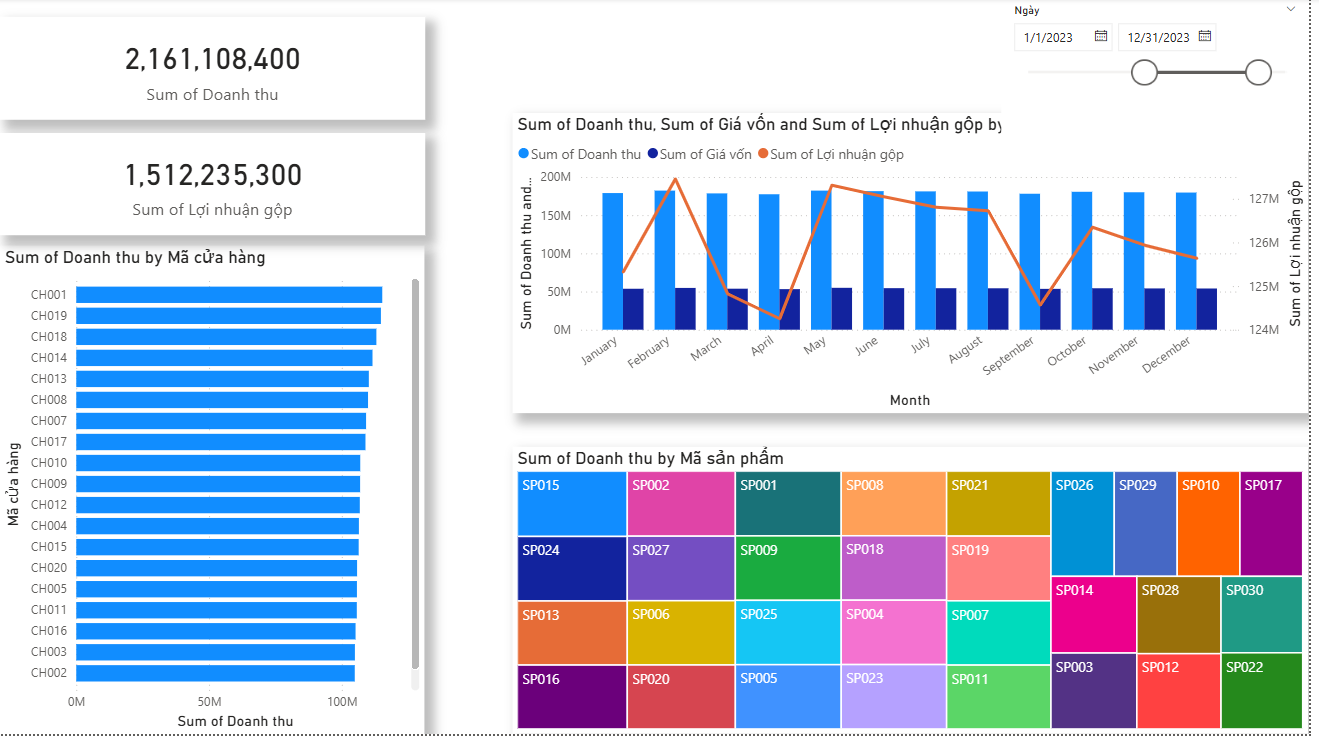
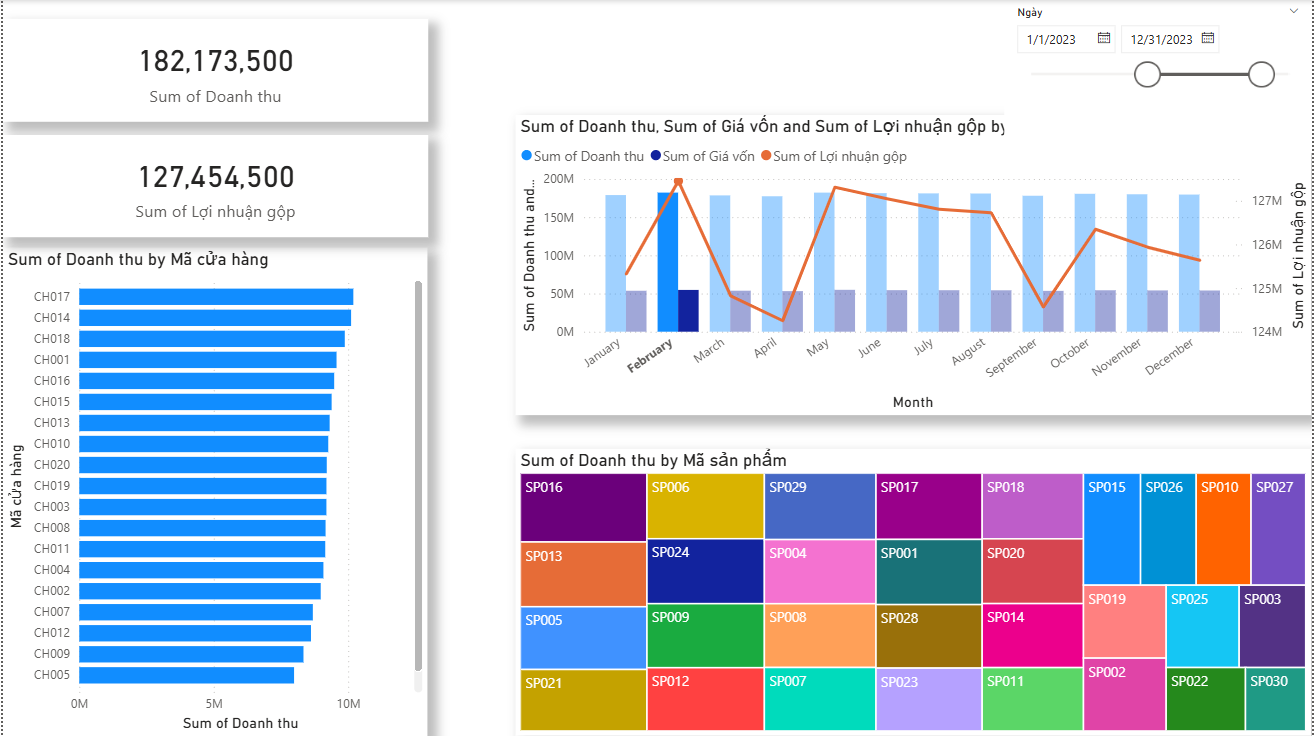
Monthly revenue, cost, and gross profit tracked across the full year. Performance broken down by store location and product SKU to surface where margins are strongest.
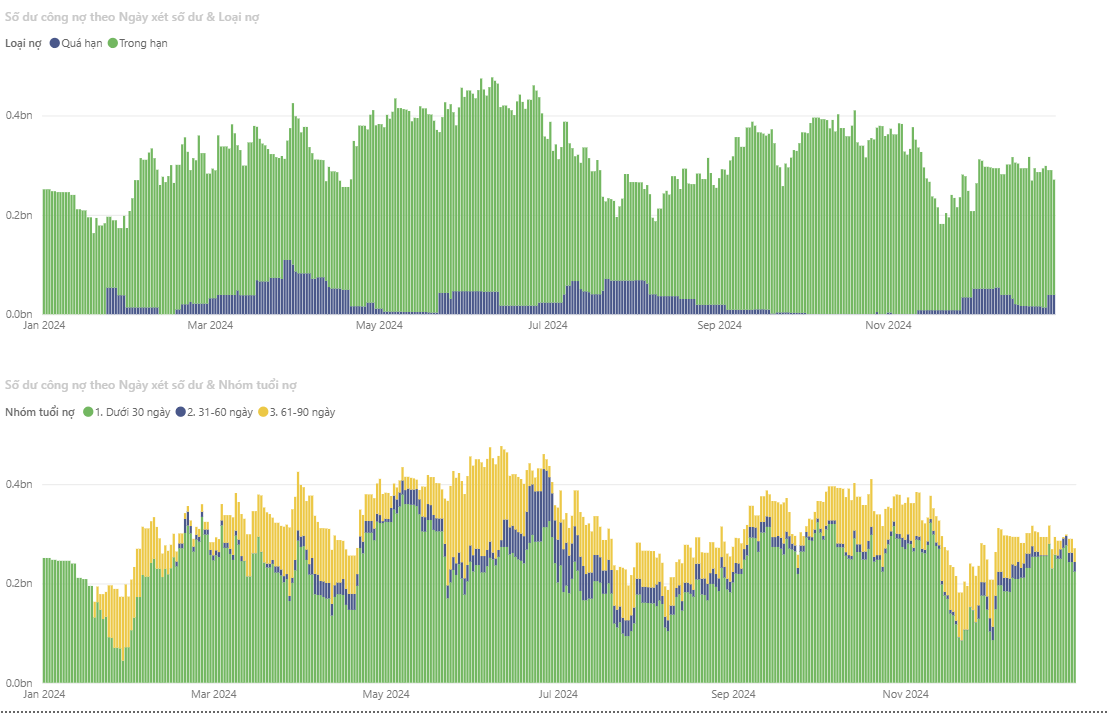
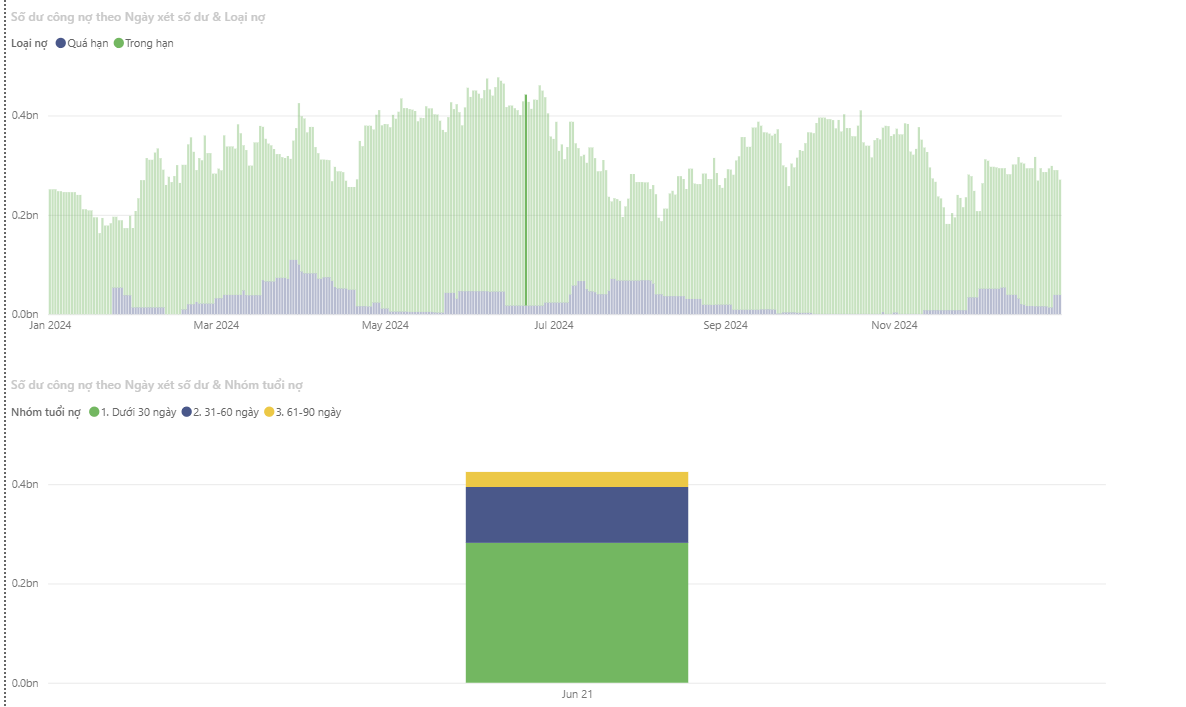
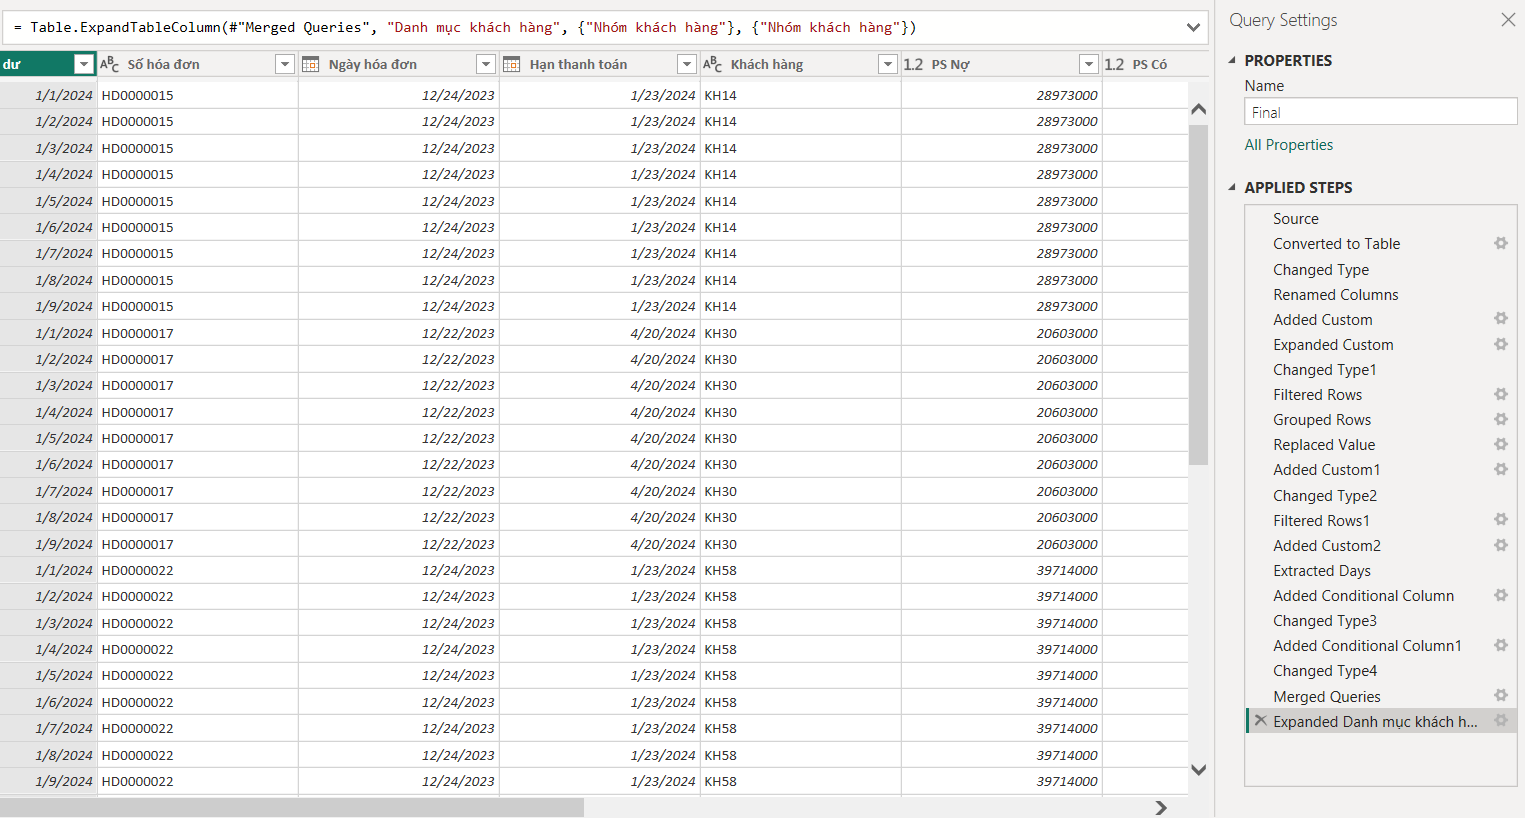
Daily receivables balance: current vs. overdue debt tracked accurately across the full year. Receivables systematically segmented by customer group and days outstanding.
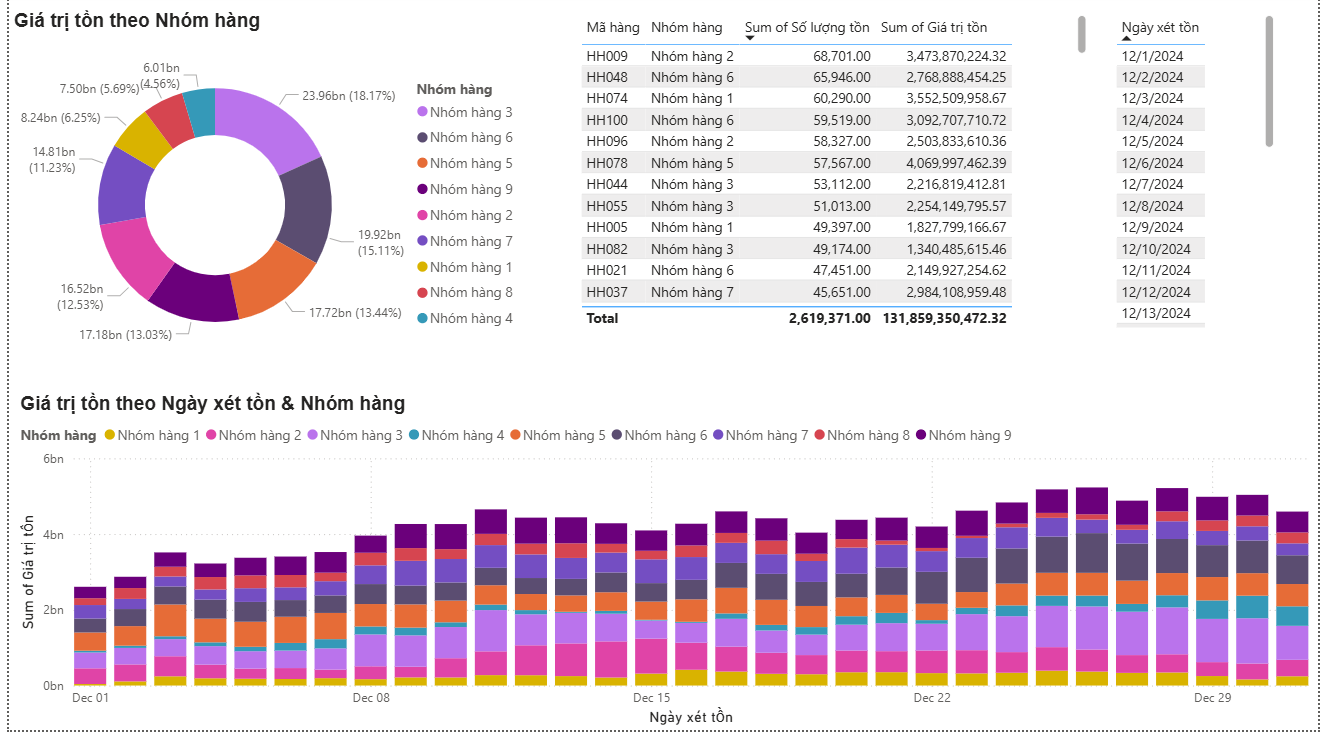
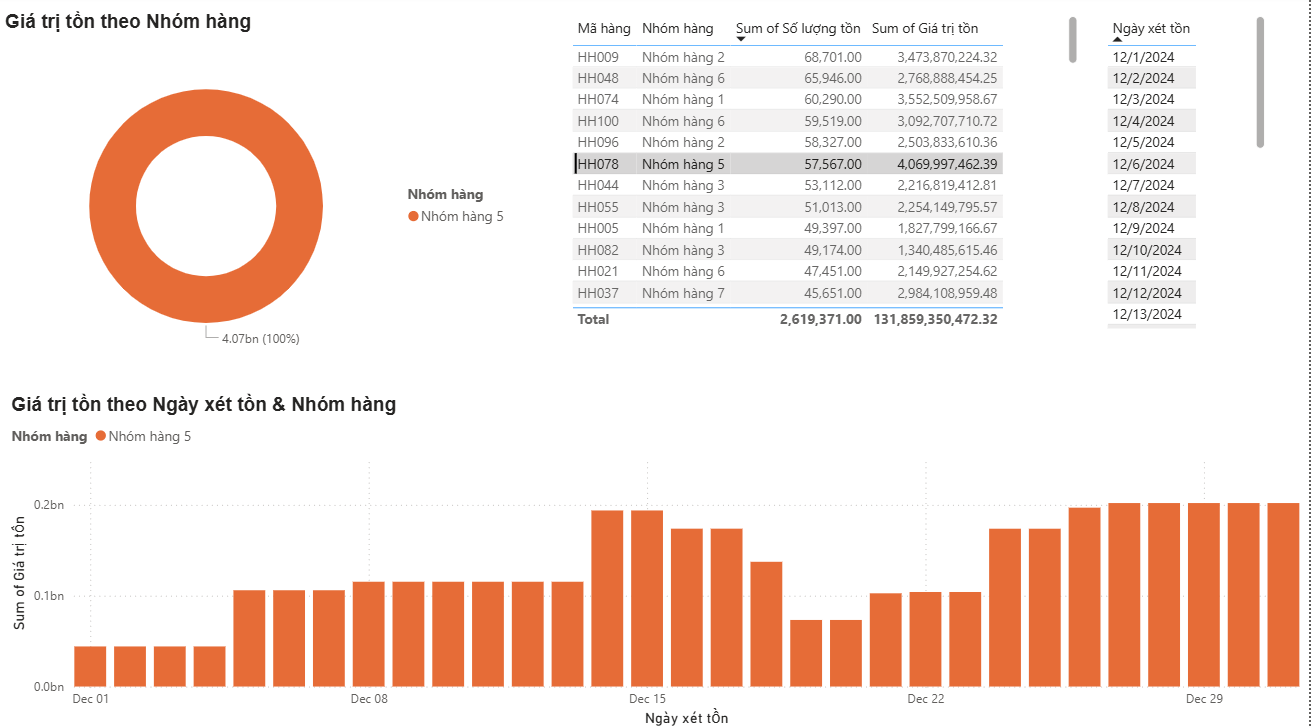
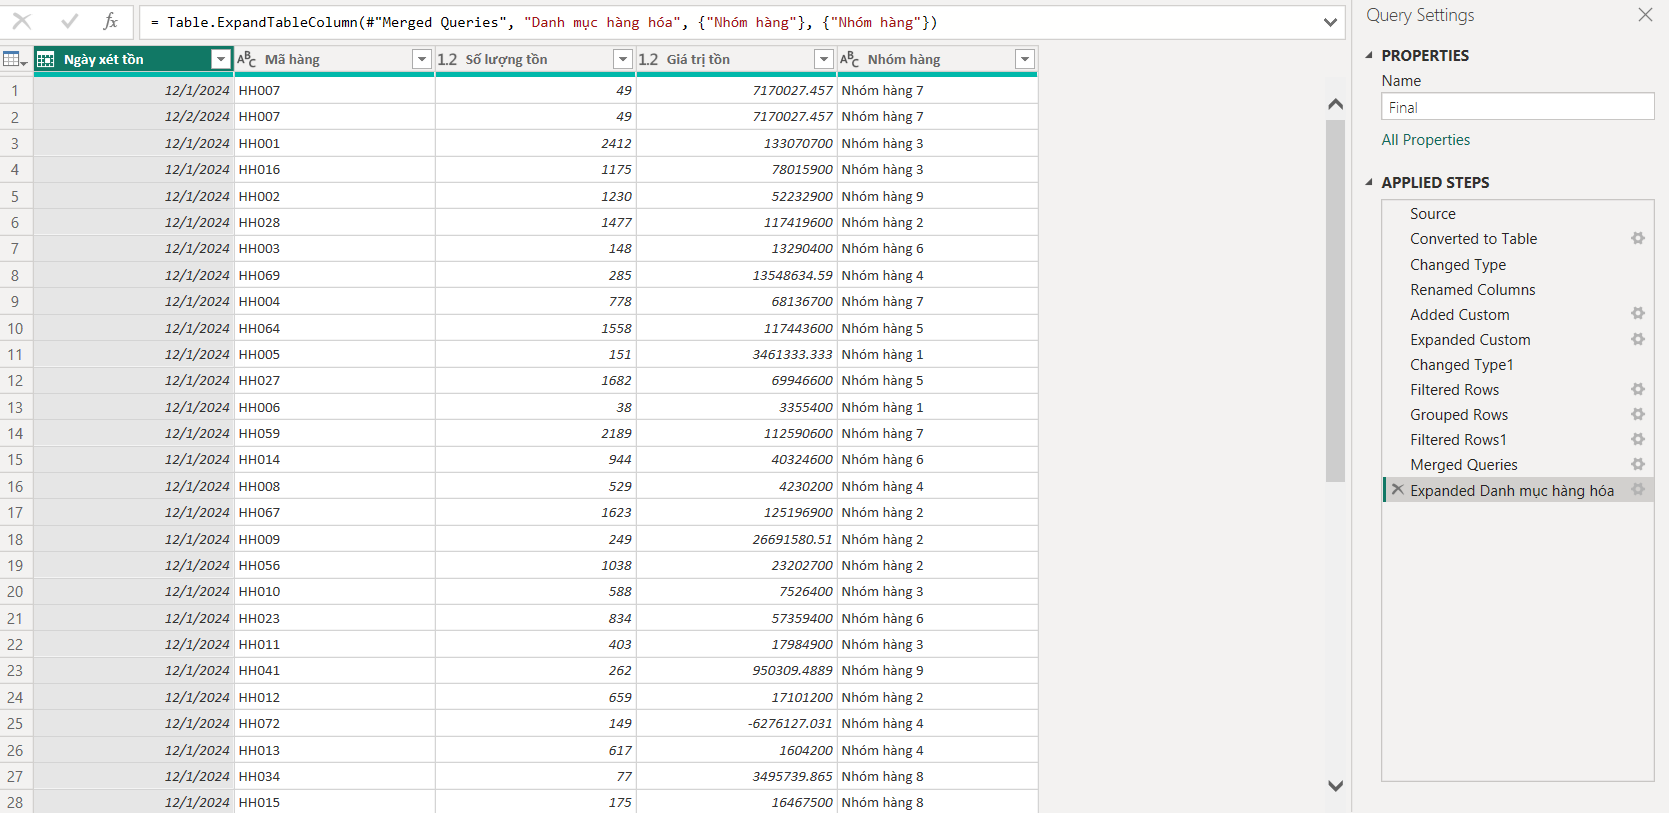
Inventory value by product group, visualizing distribution across categories as of the reporting date. Tracking stock value trends and movement velocity across December.
Every finance team needs someone who can model performance.
And someone who can make sense of the data behind it.
Every project I take on is a deliberate step toward this balance.
If you are looking for someone curious, detail-oriented, and eager to contribute - I would love to be considered.
Harvey Pham
Finance Portfolio 2026
Advisory & BOS Intern
BDO Vietnam
SME Banking Intern
MB Bank
Corporate Finance, NEU
GPA: 3.76 / 4.0
CFA Level 2 Candidate
Passed Level 1
Wall Street Prep
Valuation & Financial Modeling